


The Tech Sector Paradox: Why This Is Temporary Correction, not a Bear Market
On February 5, 2026, the financial markets witnessed a sharp downturn that sent shockwaves through the investor community. The S&P 500 fell 1.23%, the Dow Jones Industrial Average (DJIA) dropped 1.20%, and the tech-heavy NASDAQ Composite led the slide with a 1.59% decline.
As the largest component of the S&P 500, the technology sector acted as the primary factor, dragging down the broader market indices.
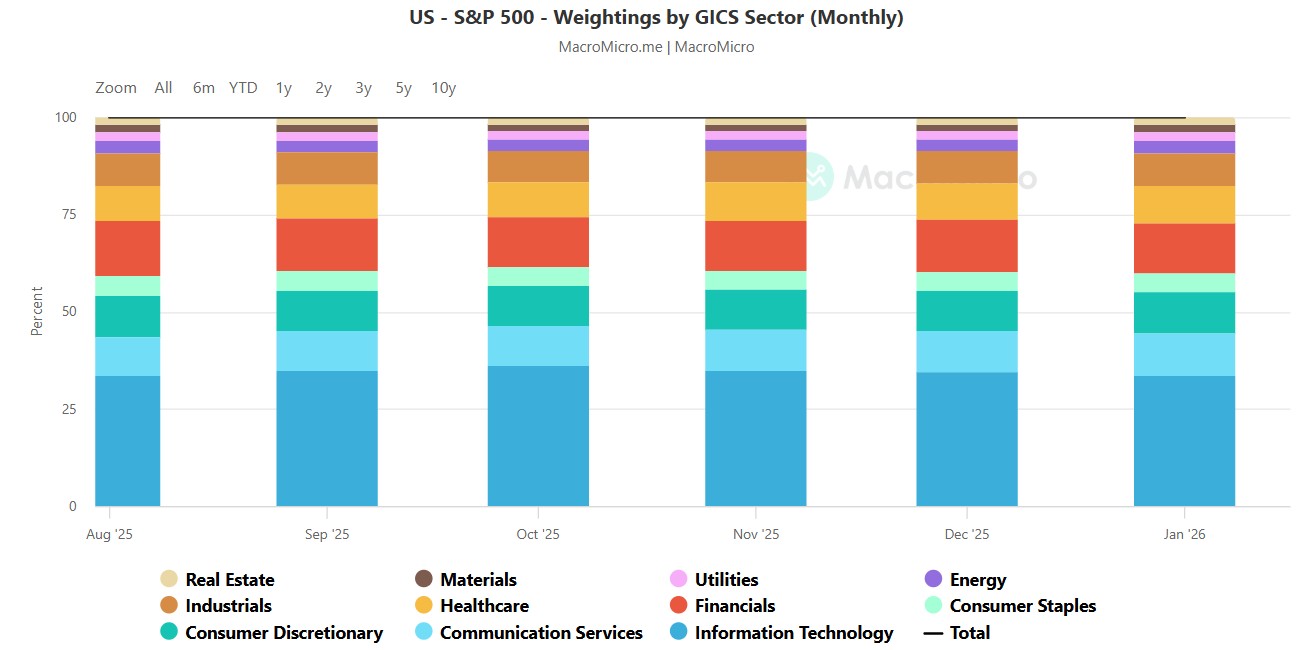
Source: MacroMicro
However, a closer inspection of the underlying data suggests that this is not the start of a structural bear market. Instead, the market is grappling with a profound and temporary "tech paradox" where stocks are being sold off for two mutually exclusive reasons.
Tech Market Paradox
The first pillar of this paradox involves the "AI Hyperscalers", the dominant titans comprising Alphabet, Amazon, Meta, and Microsoft. These companies are currently being punished by the market for investing too aggressively in artificial intelligence. Following their recent earnings announcements, investors focused less on robust revenue beats and more on the staggering escalation of capital expenditure (CapEx) estimates. There is obvious anxiety on Wall Street regarding the near-term return on investment (ROI) for these massive infrastructure projects, judging from the CapEx estimates that have increased dramatically within less than a year.
Company | 2025 Capex (Actual/Est) | 2026 Guidance (New) | % Increase |
Amazon ($AMZN) | ~$131B | $200B+ | ~53% |
Google ($GOOGL) | ~$91B | $175B – $185B | ~100% |
Meta ($META) | ~$72B | $115B – $135B | ~73% |
Microsoft ($MSFT) | ~$80B | $105B – $120B | ~40% |
Source: Company Earnings
The scale of this spending is unprecedented in corporate history, as Amazon’s 2026 guidance has climbed to over $200 billion, representing a 53% increase, while for Alphabet and Meta, the number nearly doubled. This is only one part of the picture; here we don’t even include the dramatic increase in R&D spendings that goes for salaries and stock options for the software engineers engaged in these projects.
Looking at these numbers, the market is asking the question whether the future revenue and profits will outweigh this colossal spendings.
Conversely, the second pillar of the paradox hits the other end of the software spectrum: traditional Software-as-a-Service (SaaS) companies. Firms like Salesforce, ServiceNow, Adobe, and Intuit, are being sold off dramatically because of the market fears they are not prepared for the very AI disruption that the hyperscalers are funding. The year-to-date performance for these stocks has been catastrophic to say the least.
Ticker | Company | YTD Performance |
CRM | Salesforce | -24.1% |
NOW | ServiceNow | -54.3% |
ADBE | Adobe | -23.0% |
INTU | Intuit | -19.5% |
Source: Company Earnings
The market's logic has become a contradictory "Catch-22." It punishes the hyperscalers for spending too much to build the AI future, while simultaneously punishing SaaS companies for not spending enough to survive that same future.
Same, Same, but Different
When people put labels like “Hyperscalers” and “SaaS”, they essentially ignore the fact that they are all tech stocks, but the differences is that names such as Alphabet, Meta, and Microsoft are willing and have the financial capacity to invest massive amounts of CapEx, allowing them to evolve into the AI frontrunners they currently are. The CapEx numbers from the last three years draw a very clear picture.
Company | 2023 CapEx (Actual) | 2024 Capex (Actual) | 2025 Capex (Est/Actual) |
Amazon ($AMZN) | $52.7B | $83.0B | ~$125.0B |
Google ($GOOGL) | $32.3B | $52.5B | ~$91.0B |
Meta ($META) | $28.1B | $35.0B | ~$72.0B |
Microsoft ($MSFT) | $28.1B | $44.5B | ~$83.1B |
--- | --- | --- | --- |
Salesforce ($CRM) | $0.8B | $0.6B | ~$0.7B |
ServiceNow ($NOW) | $0.5B | $0.4B | ~$0.5B |
Intuit ($INTU) | $0.2B | $0.1B | ~$0.2B |
Adobe ($ADBE) | $0.4B | $0.2B | ~$0.2B |
Source: Company Earnings
This divergence has created a massive scale gap that is often overlooked. While a giant like Salesforce might spend roughly $700 million a year on infrastructure, Alphabet’s guidance for $180 billion represents a 250-fold difference.
The numbers in the balance sheets of the above list of companies further support this narrative. Salesforce, being one of the largest SaaS in terms of operations, cannot even come close to Amazon, Google, Meta or Microsoft when it comes to cash reserves and operating cash flows.
Company | Cash & Mkt Securities | Total Debt | Net Cash (Debt) | Operating Cash Flow (TTM) |
Microsoft ($MSFT) | $102.0B | $78.0B | +$24.0B | $120.0B |
Alphabet ($GOOGL) | $126.8B | $46.5B | +$80.3B | $132.2B |
Meta ($META) | $81.6B | $59.0B | +$22.6B | $116.0B |
Amazon ($AMZN) | $88.0B | $155.0B | -$67.0B | $139.5B |
--- | --- | --- | --- | --- |
Salesforce ($CRM) | $16.5B | $13.5B | +$3.0B | $12.5B |
Adobe ($ADBE) | $5.4B | $6.6B | -$1.2B | $10.0B |
Intuit ($INTU) | $3.7B | $6.1B | -$2.4B | $5.5B |
ServiceNow ($NOW) | $5.1B | $1.5B | +$3.6B | $4.2B |
Source: Company Earnings
The market is punishing Salesforce, Adobe, Intuit and ServiceNow because they are being disrupted by AI, but the thing is there is no other way for them, as they cannot outcompete Mag7 due to the enormous gap in cash and profits.
The Broad Market Implication
The current market reaction is ultimately unsustainable because it is fundamentally illogical. The market cannot indefinitely maintain a narrative where it hates both the cost of building the new economy and the vulnerability of those who cannot afford to build it.
The broad tech sell-off we are witnessing is a classic case of the market "shooting first and asking questions later." The contradiction of punishing companies for both over-investing and under-investing in the same technology indicates that sentiment, rather than structural failure, is the current driver. As dust settles, the market will likely return to the reality that the massive CapEx from the "Magnificent 7" is an insurance policy that guarantees their dominance for the next decade. For the SaaS industry, the pressure is a "stress test" that will force innovation and new pricing models. This is not the start of a bear market; it is a temporary, albeit painful, correction in the most transformative investment cycle of the 21st century.
Nothing in this material constitutes investment advice, personal recommendation, investment research, an offer, or a solicitation to buy or sell any financial instrument. The content has been prepared without consideration of your individual investment objectives, financial situation, or needs, and should not be treated as such.
Past performance is not a reliable indicator of future performance and/or results. Forward-looking scenarios or forecasts are not a guarantee of future performance. Actual results may differ materially from those anticipated.
Mitrade makes no representation or warranty as to the accuracy or completeness of the information provided and accepts no liability for any loss arising from reliance on such information.
Recommended Articles


