



Dycom’s $4.8B Backlog Signals AI Fiber Boom — Is DY Stock a Buy?
TradingKey - Dycom Industries (NYSE: DY) posted fiscal 2026 Q1 numbers on May 20 that were better than consensus. Revenue increased 14.8% year-over-year to $1.12 billion. Adjusted EBITDA margin expanded to 11.5% and backlog increased to $4.8 billion, a record. The $4.8 billion backlog is the largest and most relevant number in the entire earnings release. In a sense, DY revenue does not depend on demand cycles of any given product or seasonal demand of chips. DY revenue is dependent on contracting and delivering a project. Hence, the backlog tells you how many months of revenue are locked in to be delivered. Dycom (DY) is not a semiconductor stock, not software company. It is the infrastructure builder (fiber, broadband) for all the fiber hungry AI data centers, hyperscalers and 5G networks.
Q1 FY2026 Results — Record Backlog and Expanding Margins from AI-driven Infrastructure Demand
The record backlog and margin expansion from AI-driven infrastructure build is great news and it is Q1 FY2026 results. The Q1 results were exactly what the bulls were looking for. It brought in $1.12B in revenue up 14.8% YoY as it continues to build out fiber-to-the-home network, to densify 5G networks and work on more data center interconnectivity. Adjusted EBITDA came in at $128.4 million and EBITDA margin increased to 11.5% demonstrating its focus on more profitable projects and the continued pricing discipline CEO Steven Nielsen has implemented throughout its backlog growth years. At the end of the quarter, backlog is $4.8B. If DY annualized current quarterly revenue, backlog would equal roughly the next four to five quarters of revenue work already lined up.
DY is up $528.06, above 1.618 and 2.0 Fibo extensions on 4H chart and is building a base right below the 2.272 Fibo extension at $530.59. RSI is between 56 and 80 and there is no sign of bearish divergence in RSI. Next Fibo extension support level around $514.62 (2.0 Fibo level).
Dycom is an AI infrastructure stock, but in a more direct way that the market doesn’t yet recognize. Dycom installs the physical infrastructure that powers data centers: fiber backhaul, underground conduits running between data center facilities, power grid interconnections to data centers and hyperscaler sites, and last-mile broadband infrastructure to the end consumer. Every time Amazon, Google, Microsoft, or Meta builds a hyperscale AI data center, there is a physical plant to go with it, and Dycom is one of the main contractors on that project. BEAD broadband funding that’s just started to roll out means another layer of guaranteed government spending over and above the private sector telecom and hyperscaler work currently in the backlog.
Why the Backlog Makes Dycom a Different AI Play
Most of the AI trade revolves around hardware or software and is directly tied to growth in AI-related spending. Dycom, on the other hand, is less dependent on that dynamic. What Dycom books into backlog today will result in revenue over the next four to eight quarters no matter what the sentiment is on AI spending, because that work is already contracted. Customers rarely pull out mid-construction, as it is too costly and logistically difficult to do so, so the switching cost is there for customers.
The net result is that Dycom is more predictable than most tech firms when it comes to future earnings. If the company continued to book contracts at these levels, it would amount to roughly $550 million of EBITDA over the next few quarters from that backlog alone. It will take that amount before any quarter’s results show it.
The other advantage of Dycom is the wide diversification of customers and industries served. The company generates revenue from the likes of AT&T, Verizon, and Comcast when it comes to building out broadband networks, while also generating revenue from utilities for grid hardening projects and smart grids. As the company has moved into more data center construction as a part of the broader AI trade, it is generating revenue from the data center builders themselves. Dycom’s major customers don’t account for any significant part of total revenue. This means that the backlog of work is spread out across multiple clients and multiple investment cycles.
If a major telecommunications provider has slowed its capital spending, the company will still be building utility grid hardening projects, as well as deploying broadband networks through the BEAD broadband funding program. The diversification is a built-in risk hedger.
DY Technical Analysis — Fib 2.0 Hold at $514 With 2.272 Target at $530
The technical analysis for the stock points to a strong buy signal. DY closed out the day on the 4H chart, having recently broken the 1.618 Fibonacci extension level at $492.50 and the 2.0 extension at $514.75 before a volume spike. After that, the price fell a bit from its high of $550+ to settle back down in the consolidation zone around $528. The red dynamic support rising from the $398 lows is in place as new higher lows keep forming.
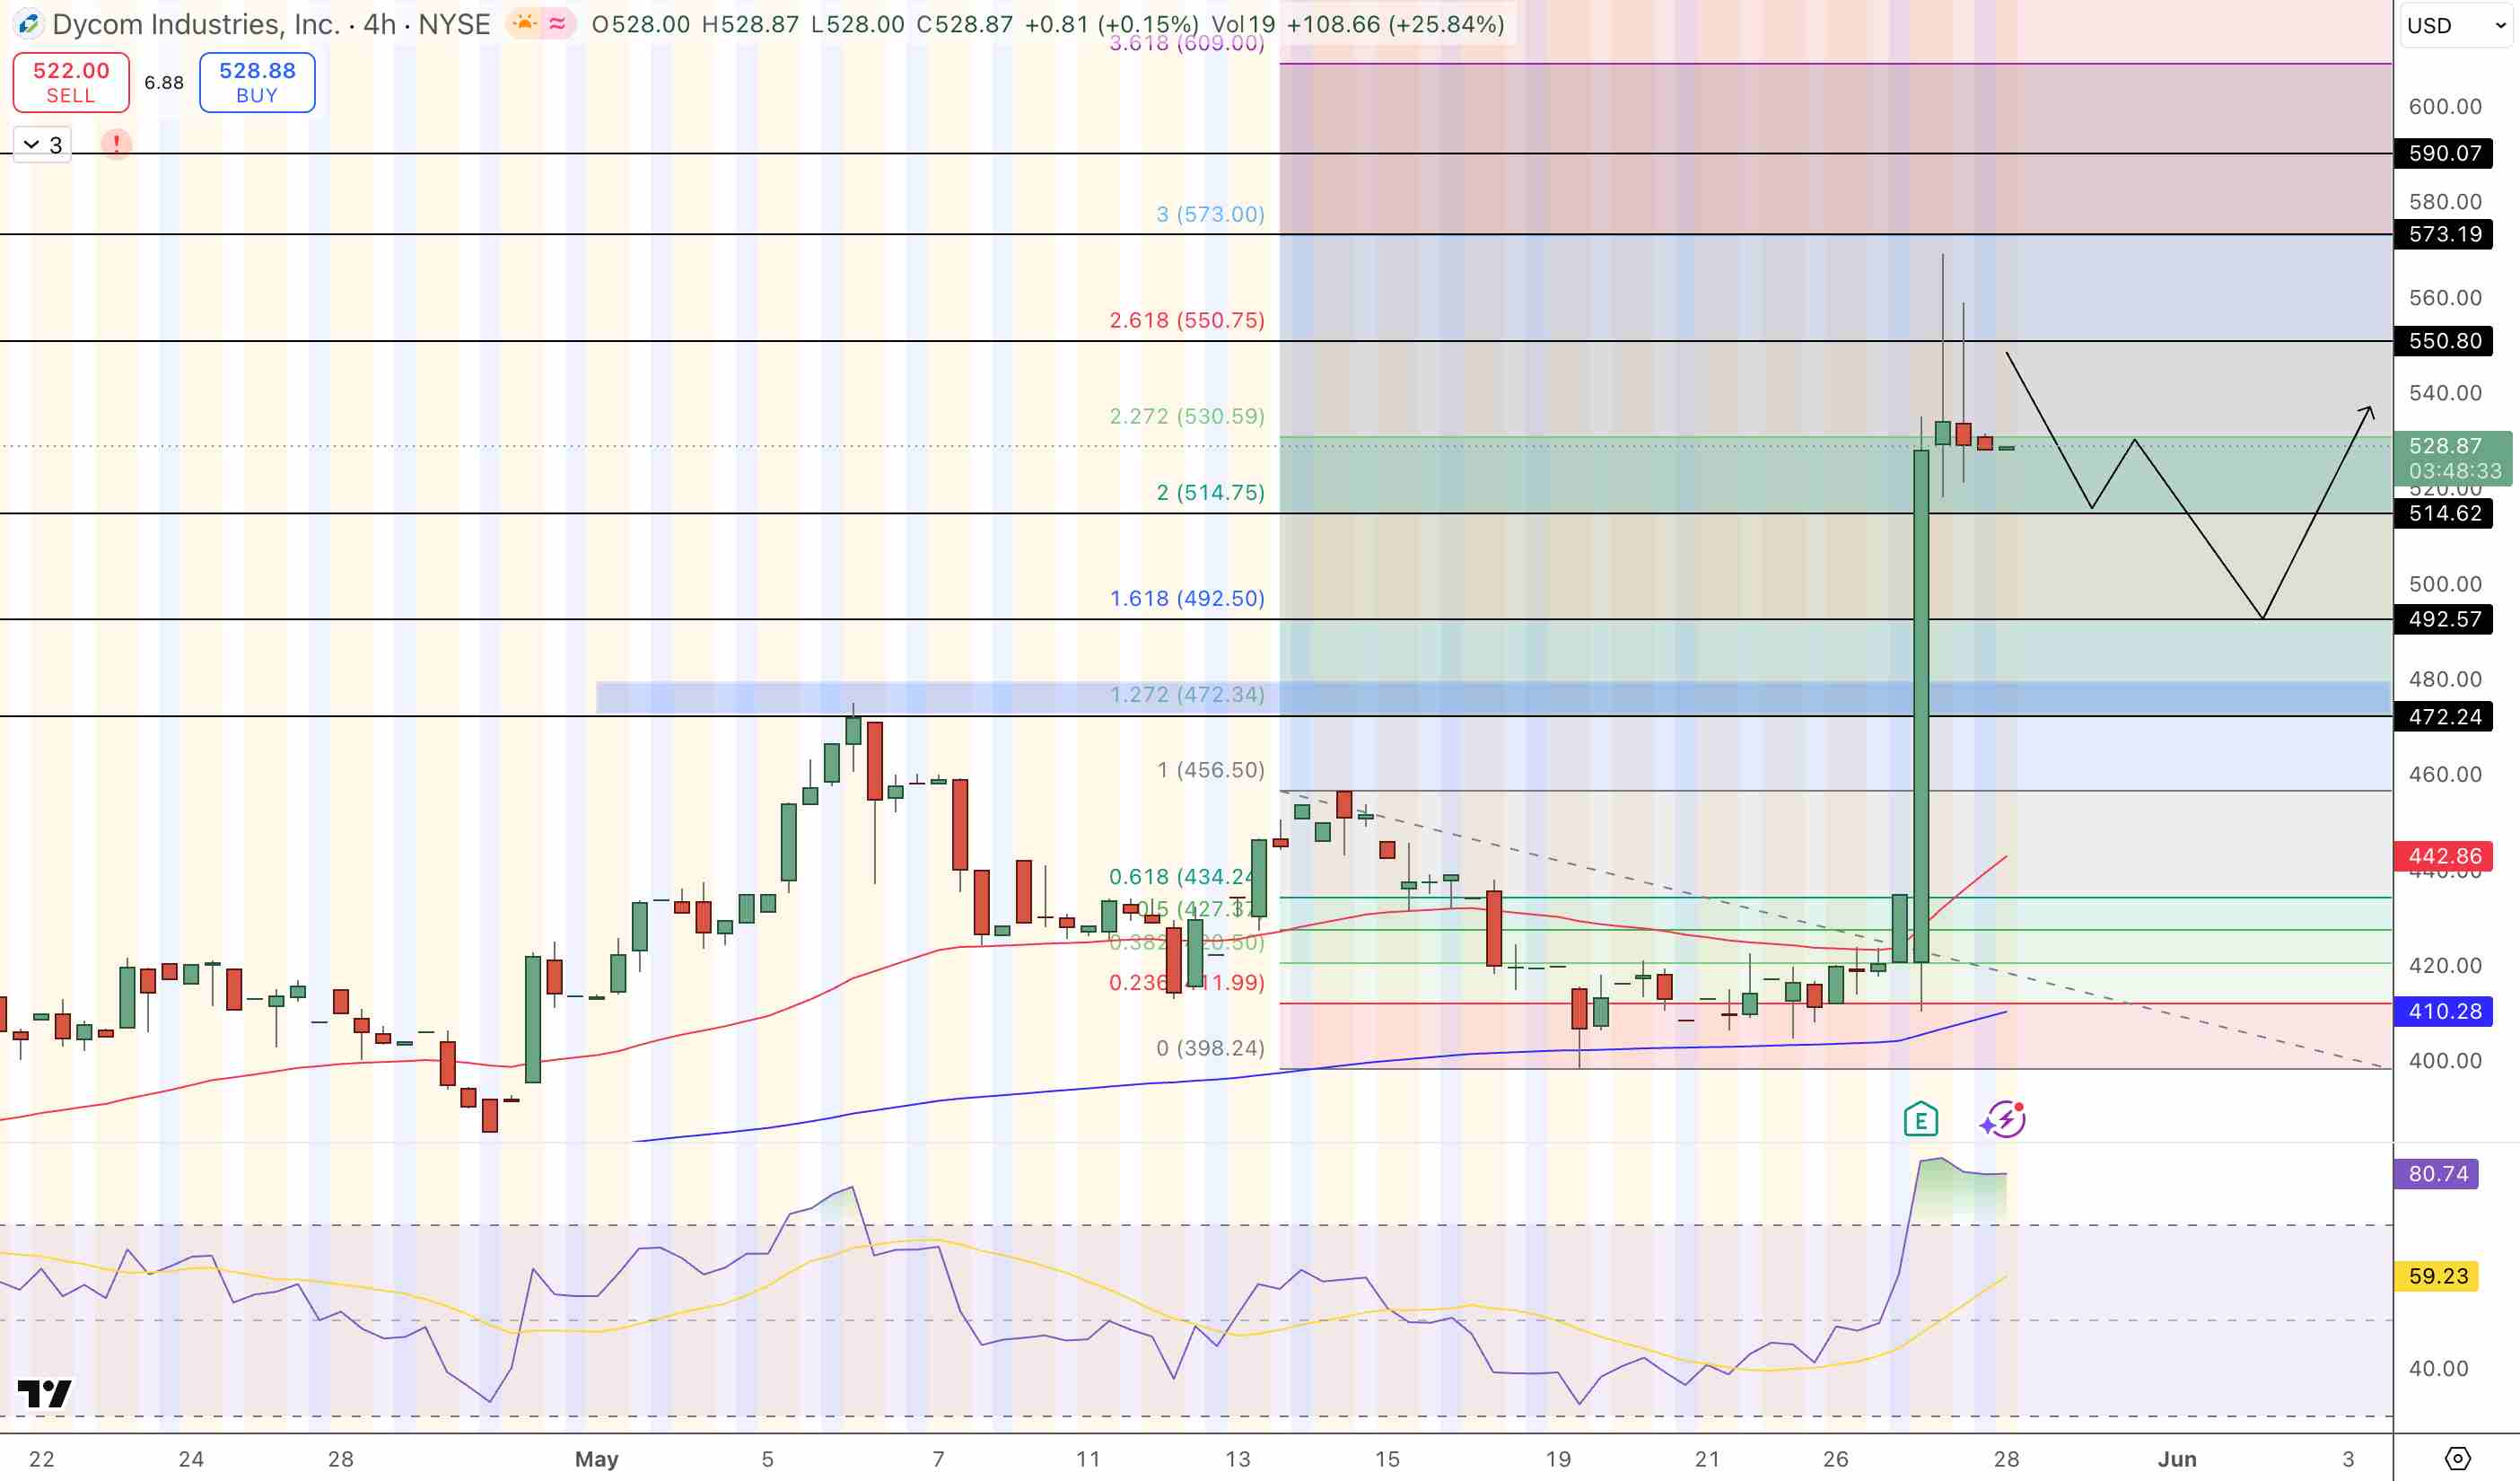
The price is moving slightly lower after hitting the RSI levels between 56 and 80, but there’s no sign of bearish divergence. Resistance at this point sits at the 2.272 extension at $530.59, which is currently only $2.53 away from the trading price. The next target after this is the 2.618 extension level at $550.75. There’s strong support near $514.62 to $492.57.
TRADE SETUP
Entry: Long above $530 (Fib 2.272 confirmed)
Target: $550. (Fib 2.618 extension)
Support: $514.62 (Fib 2.0 level now acting as support)
Stop loss: Daily close below $514 ( 2.0 Fib support fails)
What were Dycom's Results for Q1 FY2026?
In the first quarter of its fiscal 2026, Dycom announced Q1 revenues totaling $1.12 billion, a 14.8% increase year over year. The company achieved adjusted EBITDA of $128.4 million, reflecting an 11.5% margin. The backlog reached an unprecedented $4.8 billion, indicating roughly four to five quarters of revenue that's already in the bag from contracts signed. Growth in the quarter came from fiber-to-the-home initiatives, 5G network densification, data center connectivity, and utility grid projects. Dycom's Q2 FY2026 earnings are forecasted to be released toward the end of August. KeyBanc, Raymond James, and Truist have Buy ratings, along with a consensus $280 to $300.
How Does Dycom Participate in the AI Buildout?
Dycom constructs the infrastructure layer that all AI data centers require: optical fiber between buildings, underground conduit from data center campuses, power feed connections to hyperscaler campuses, and last-mile broadband connections to premises. Dycom is among the main general contractors to build out the physical construction requirements that surround each of the major AI data centers built by the likes of Amazon, Google, Microsoft, or Meta. The BEAD broadband funding program provides a federal funding demand overlay above commercial hyperscaler and telecom demand already accounted for by the $4.8 billion backlog.
Is DY a Buy at $528 in May 2026?
The technicals are favorable. DY is trading above the Fib 2.0 at $514.75 and below the Fib 2.272 at $530.59, setting the stage for a test of $550.75 if DY breaks out above $530. A trailing stop loss below $514 would manage downside. The fundamental case is also strong. Dycom's $4.8 billion backlog, 14.8% revenue growth, 11.5% EBITDA margin, and revenue predictability from the backlog-based business model support the bull case. Potential challenges include telecom capital expenditure slowdown, BEAD grant disbursement lagging behind expectations, and any margin compression caused by labor or materials cost spikes.
Bottom Line
Dycom's $4.8 billion backlog isn't just an order book, it's the next four to five quarters of revenue, with no matter what the near-term AI sentiment does about AI capex spending. The company's business of building the fiber and data center connectivity that hyperscalers need, plus the federal government-funded demand side of BEAD, is an additional layer on top of already committed commercial work. At $528, DY is consolidating at the Fib 2.0 zone, with no bear divergence and higher lows intact. Once it trades above $530, it targets $550.75. The next major catalyst is the Q2 earnings report in late August. Until then, keep an eye out for BEAD disbursement announcements or hyperscaler data center expansion announcements.
Nothing in this material constitutes investment advice, personal recommendation, investment research, an offer, or a solicitation to buy or sell any financial instrument. The content has been prepared without consideration of your individual investment objectives, financial situation, or needs, and should not be treated as such.
Past performance is not a reliable indicator of future performance and/or results. Forward-looking scenarios or forecasts are not a guarantee of future performance. Actual results may differ materially from those anticipated.
Mitrade makes no representation or warranty as to the accuracy or completeness of the information provided and accepts no liability for any loss arising from reliance on such information.
Recommended Articles


