



Micron Stock Pulls Back After Surge, $1,000 Mark Is Ceiling or Starting Line
TradingKey - Micron Technology's stock price undergoes a slight pullback, with a short-term downside potentially testing the $800 support level.
During the pre-market session on May 28, Eastern Time, Micron Technology ( MU) fell by over 3% at one point, hitting a low near $897. As of press time, Micron's stock narrowed its losses and returned above $900. Yesterday, the company's share price failed to break the $1,000 psychological barrier, peaking at $956. Moving forward, will Micron's stock price pull back or continue its rally?
Since the start of this year, Micron's stock price has surged continuously, gaining more than 200% cumulatively. This rally has been driven by multiple tailwinds, including strong earnings performance, public praise from President Trump stating that 'Micron is great,' and UBS analyst Timothy Arcuri's significant upward revision of Micron's price target.
However, while Micron has captured significant excess profits, Samsung and SK Hynix are expanding HBM capacity regardless of cost. This move could undermine Micron's current absolute pricing power, which is clearly a headwind for its stock price. Furthermore, Micron announced that it will release its latest quarterly earnings report on June 24, 2026. During the upcoming month-long earnings lull, the lack of further material catalysts makes it difficult for the stock to force a breakout above $1,000 on sentiment alone, likely leading to a structural sideways consolidation.
Moreover, no asset can rally in a straight line without looking back, and Micron is no exception. At the beginning of 2026, Micron's stock was trading near $315; it then skyrocketed nearly threefold in just five months, with the gain in May alone setting a historical record. In the short term, both daily and weekly indicators have entered extremely overbought territory. As the stock price approaches the massive psychological barrier of $1,000, long-term investors with significant unrealized gains and quantitative funds will inevitably have a strong urge to take profits, resulting in heavy selling pressure at these elevated levels.
From a technical perspective, the RSI has risen to 76 and is entering overbought territory, signaling that buying momentum is overheated and a collective sell-off could occur at any time. Although the exact timing remains uncertain, the risk of a correction has increased significantly. Looking ahead, Micron's stock price is highly likely to briefly break the $1,000 mark—creating a bull trap—before rapidly retreating to the $800 support level. In an extreme scenario, it could even drop toward $650.
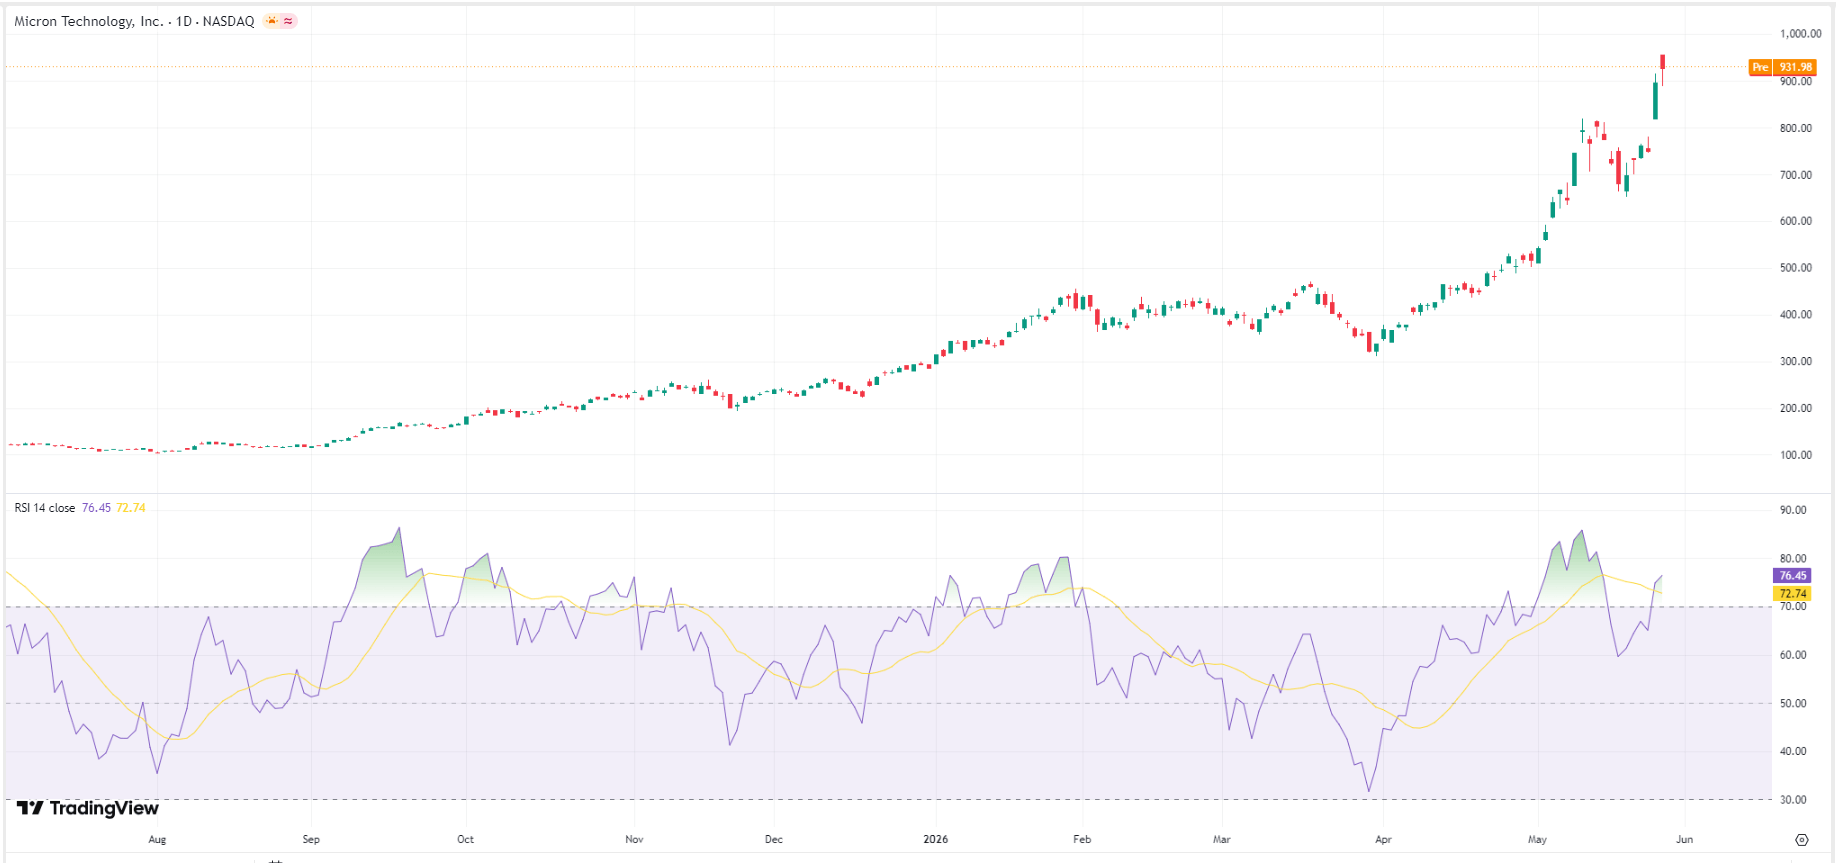
Micron Technology stock price chart, Source: TradingView
Nothing in this material constitutes investment advice, personal recommendation, investment research, an offer, or a solicitation to buy or sell any financial instrument. The content has been prepared without consideration of your individual investment objectives, financial situation, or needs, and should not be treated as such.
Past performance is not a reliable indicator of future performance and/or results. Forward-looking scenarios or forecasts are not a guarantee of future performance. Actual results may differ materially from those anticipated.
Mitrade makes no representation or warranty as to the accuracy or completeness of the information provided and accepts no liability for any loss arising from reliance on such information.
Recommended Articles


