



SpaceX (SPCX) Week in Review: Down 47% From High, Starship 13 Pending, Earnings Aug 4
TradingKey - SpaceX (NASDAQ: SPCX) closed Friday at $116.06 on July 25, bouncing back from a fresh all-time low of $110.85 that the stock touched on Thursday. As of this writing, the stock is down 47% off its peak of $225.64 which came just after the June IPO. That debut raised $85.7 billion for the company and briefly put it at over $2 trillion in valuation. Three things are on deck this week.
Starship Flight 13 (SF13), also delayed Thursday, may have a second wind, the first-ever public company Q2 earnings will be released Aug 4, and Aug 6 is when a portion of the company's lockup expires. Short interest is currently at 32% of the float. The channel descending from the high in June remains.
The Week That Was: How $1 Trillion in Value Disappeared
Last month SpaceX's June IPO was the largest in history, raising $85.7 billion, issuing shares to the public on the Nasdaq via ticker SPCX, and briefly reaching over $2 trillion in valuation. It hit a high of $225.64 on June 16. Since then it's been dropping in a channel. Thursday July 24, the stock hit $110.85 before a modest recovery to $116. The market value has fallen over $1 trillion in about five weeks.
This is what happens when there's an initial valuation based on the interest of investors, followed by an attempt to re-set that value via market participation, without the restriction of insider selling.
The events this week driving the price action include: the market is selling tech growth stocks with high multiples, with Alphabet and Tesla both seeing large drops after earnings; the delay to SF13 on Thursday creates uncertainty around an event traders were already positioning on; 32% of the float is sold short, meaning a large % of the float is held by a trader who wants to see this go down; and Elon Musk's public message to the shorts saying they won't make it through the week, which made the news headlines, but doesn't do much to the technical price action. The things that will impact the technical price action include a SF13 success or an August 4 earnings print that goes well.
Starship Flight 13: What It Is and Why It Matters
SF13 was originally planned to take place at 5:45 PM CT July 23 in Starbase, Texas. But due to weather, the event is also delayed. Thursday night there will be rain, thunderstorms and wind, so the rocket isn't going to be launched. The first attempt was to take place on July 16, but the launch was delayed due to an engine problem. If SF13 launches, the plan is to launch 20 next-generation Starlink V3 demo satellites to orbit, test out laser communications between satellites, attempt a Super Heavy booster recovery, try out an in-space Raptor engine relight, and do a controlled Starship upper-stage landing sequence.
The payload, the Starlink V3 satellites, is significant because V3 satellites are meant to have a lot more capacity than the current V1.5 satellites. That capacity is a critical piece for Starlink to grow its subscriber base without increasing launch cadence. Some traders on Stocktwits were positioning on SF13 being a 29% upside move to $150. It's been a long time for Starship investors.
The bull case here is that if the Starship rockets are fully reusable, the cost per orbital launch drops to approximately 10% of Falcon 9 launch costs, so the economics of putting up a bunch of satellites in orbit for Starlink, putting up satellites for NASA to launch to the Moon, and putting up cargo for a mission to Mars is significantly cheaper to achieve. If SpaceX has a successful SF13 that would be the biggest single operational event they can achieve before the earnings print on August 4th.
August 4 Earnings - First Ever and a Lock-Up Trigger
The SpaceX Q2 2026 earnings release on August 4 represents the most critical financial moment for the publicly traded company to date. As a public company, this will be the first time SpaceX discloses full quarterly financial results to public investors. This data is set to include revenue, operating margin, Starlink subscriber growth, launch-related revenue, and cash flow data. Historical reporting limitations had previously obscured SpaceX’s financial operations.
Secondly, the Q2 earnings disclosure could begin to lift the lock-up restrictions, in part because the timeline for Q2 and Q3 disclosures are linked, and August 6 could be the date at which millions of insider-held shares may start becoming liquid. With SpaceX stock at $116 today, well above what most early employees and investors paid for their shares, the impending unlock will likely represent material supply for the shares, regardless of whether insiders actually sell the shares.
31 Wall Street analysts cover SPCX, with an average 12-month price target of $235.18, a high of $800 and low of $115. This week ARK’s Cathie Wood is buying SpaceX shares, while former early-stage investor Gavin Baker, appearing on CNBC, stated he isn’t concerned as the drawdown is normal during an initial public offering.
SpaceX is also in discussions with the Defense Department to provide AI capability, which could establish a new government business alongside Starlink and the launch business. Musk loaded Grok with SpaceX’s engineering data to date this week, helping advance the company’s segment it calls the frontier LLM + X + AI computational infrastructure.
SPCX Technical Setup for the Week Ahead
SPCX is in a well-defined descending channel on the 4H chart since the June high. Trading at $117.64, the stock is below the 50-period exponential moving average at $131.93 and is capped by the resistance of the channel. Thursday’s all-time low of $110.85 probed the $114.51 support below before the rebound.
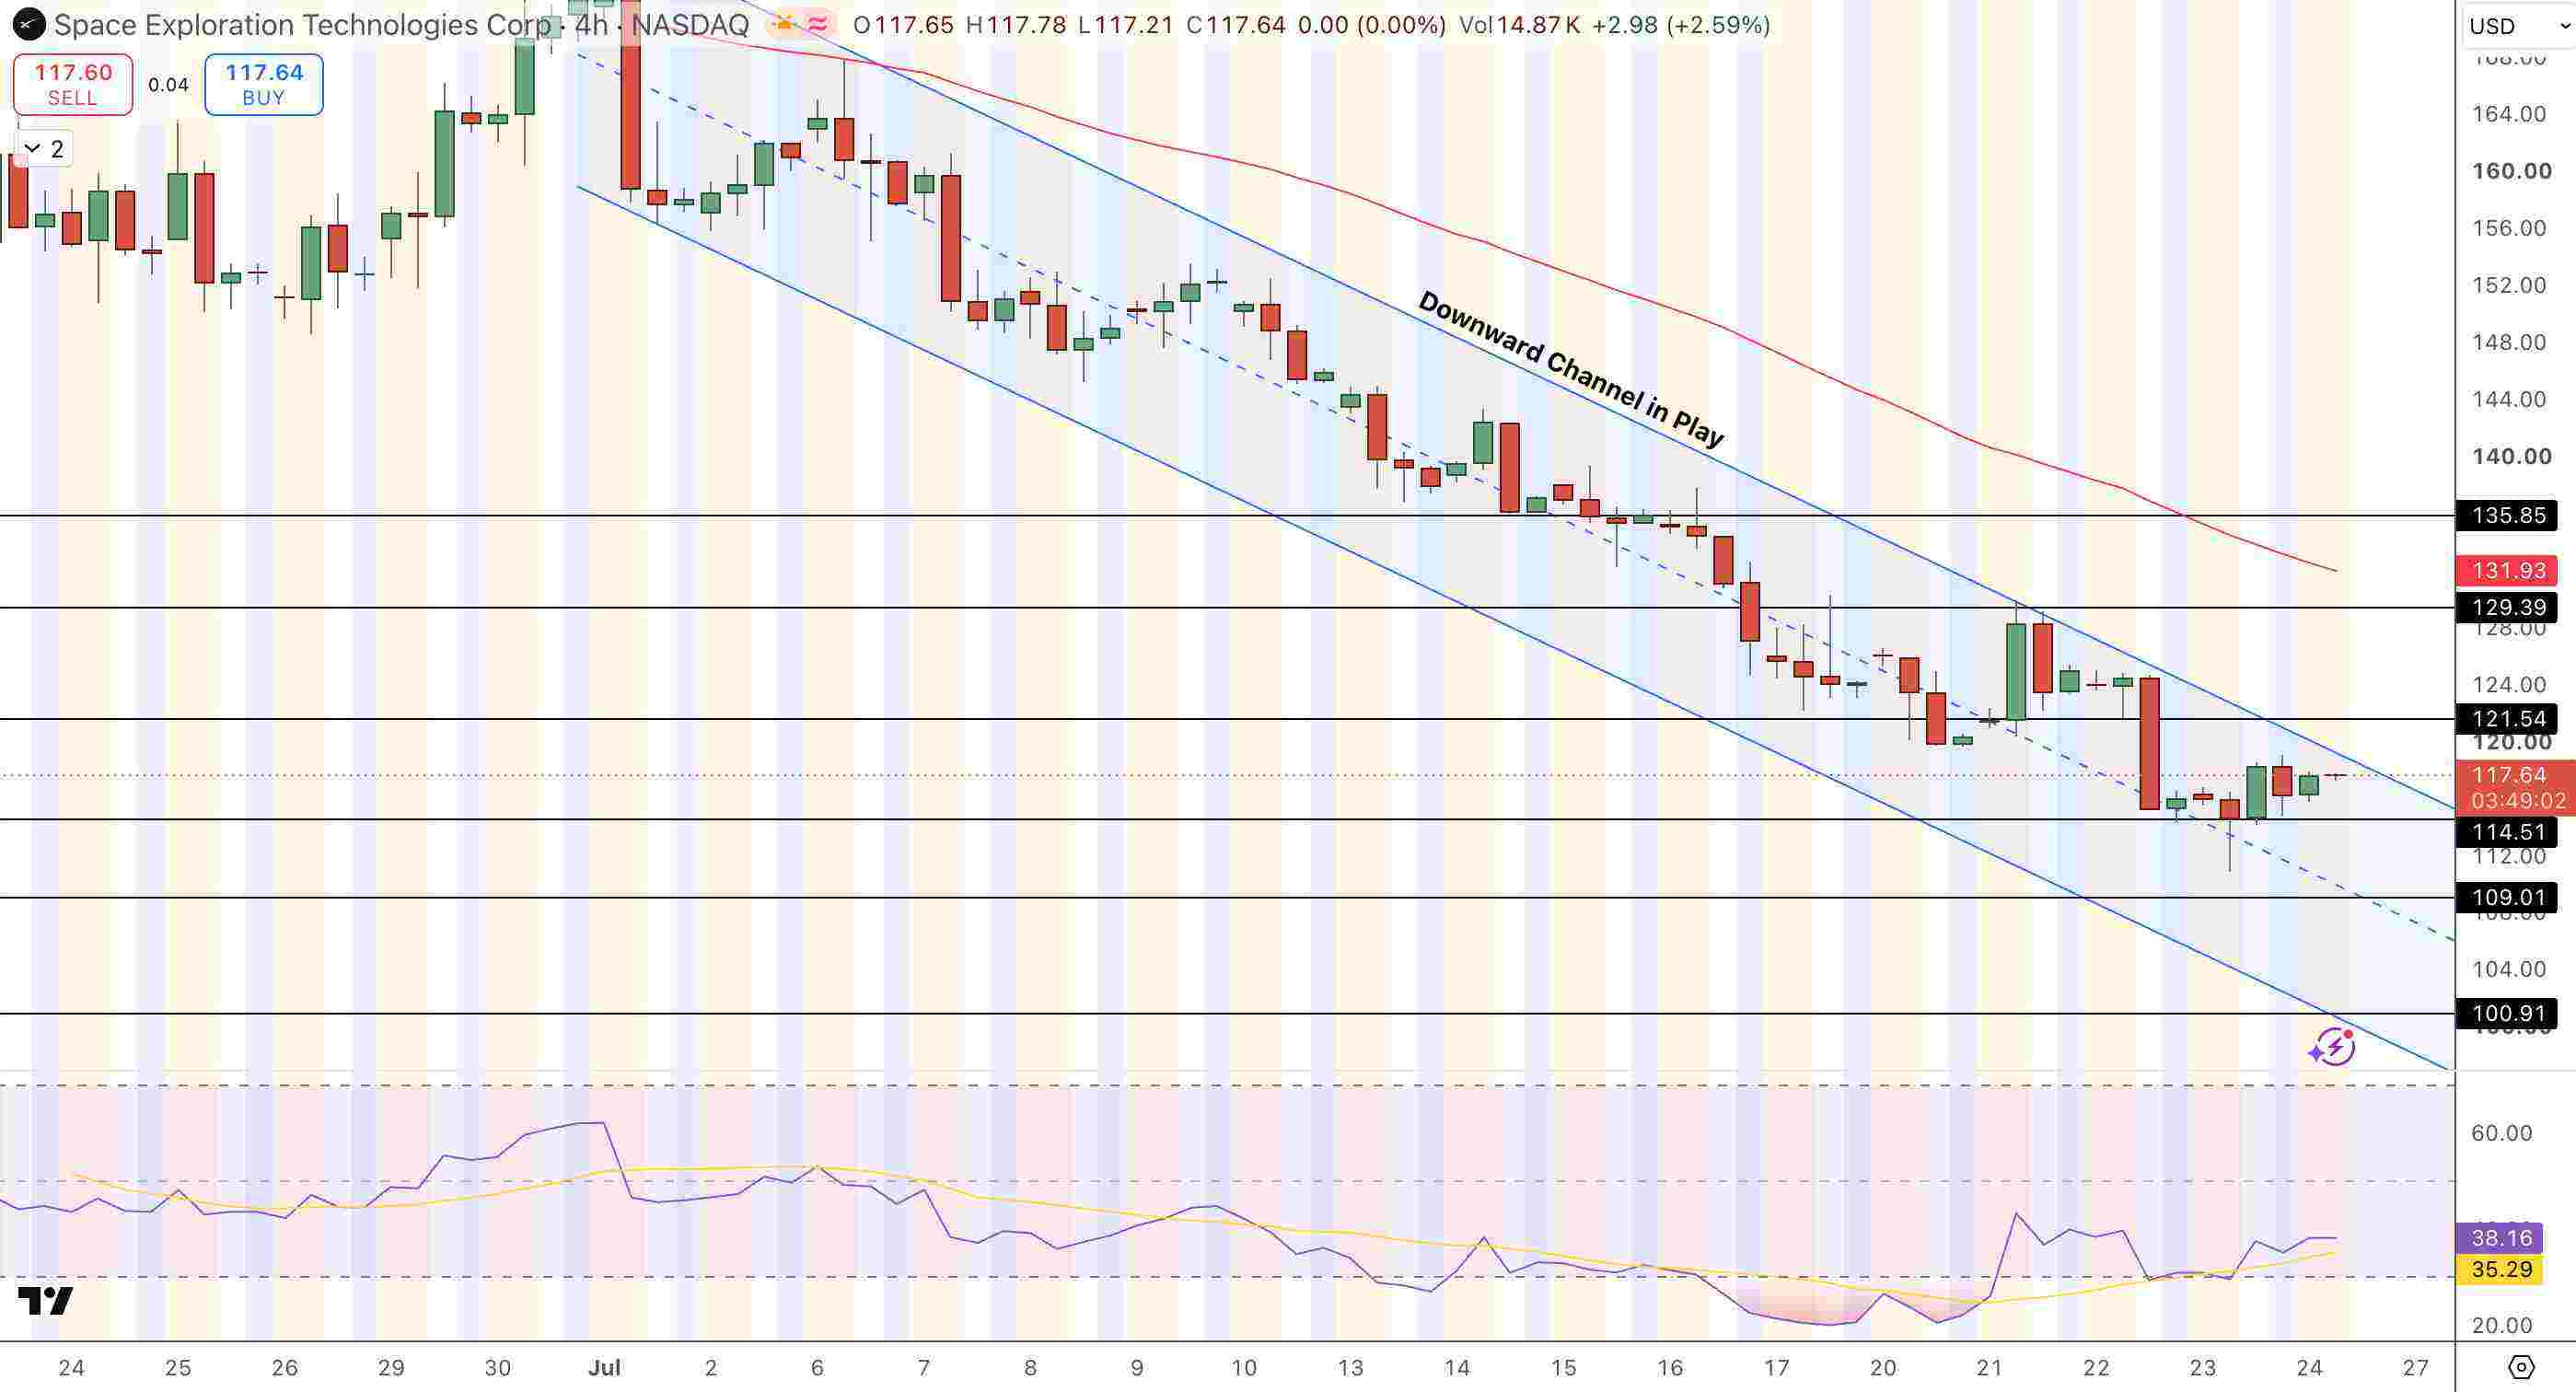
SpaceX (SPCX) Price Chart - Source: Tradingview
The RSI has recovered to 38.2 from what would have been deeply oversold conditions at the Thursday low. $121.54 is the first level of the bulls, and the next channel resistance level at $129.39. If the bulls can break above the channel, $135.85 remains in play. If we break below $114.51, $109.01 is the next key support level, with $100.91 representing the area the bears are aiming for.
Key Levels for the Week Ahead
- Last week’s close: $116.06. High 52 weeks was $225.64 on June 16. Low 52 weeks was $110.85 on July 24. Down 47% from the high.
- Starship 13: The launch was again delayed Thursday for weather. Launching 20 Starlink V3 satellites, and attempting booster recovery and relight.
- August 4 earnings release. Earnings release is after market. First public company financials. Lock-up may lift on August 6.
- 32% of the float is shorted. Musk has called out the shorts publicly.
- Average Wall Street 12-month target: $235.18 (31 analysts). High: $800. Low: $115.
- The key resistance is at $121.54, then $129.39. If breached, $135.85 remains on the table.
- Support is currently $114.51. This area was tested on Thursday. Support at $109.01 and at $100.91 below.
Bottom Line
SpaceX closed the week out at $116, down 47% from a June high of $225.64 after setting a record low of $110.85 on Thursday. Short interest stands at 32%. The downward channel from the June high continues.
The near-term direction will be defined by two events: a rescheduled Starship Flight 13, which was weather-delayed on Thursday, and the first public company earnings on August 4, which also could mark the August 6 lock-up date. The consensus analyst target is $235 among a field of 31.
The structure is bearish below $121.54. We will need a breakout out of the channel to $135, likely from a successful launch or an earnings report that provides the financial visibility that the market is currently missing.
Nothing in this material constitutes investment advice, personal recommendation, investment research, an offer, or a solicitation to buy or sell any financial instrument. The content has been prepared without consideration of your individual investment objectives, financial situation, or needs, and should not be treated as such.
Past performance is not a reliable indicator of future performance and/or results. Forward-looking scenarios or forecasts are not a guarantee of future performance. Actual results may differ materially from those anticipated.
Mitrade makes no representation or warranty as to the accuracy or completeness of the information provided and accepts no liability for any loss arising from reliance on such information.
Recommended Articles


