



Micron Stock Forecast: 2027 HBM Contract Prices May Rise 140%, Memory to Account for 68% of CSP Capex, Stock Could Reach $1,000
TradingKey - On August 26 ET, Micron (MU) shares hovered near $940, approaching the lower boundary of its ascending channel. Meanwhile, expectations of rising HBM prices continue to strengthen. TrendForce projects that despite price caps in some long-term agreements, HBM contract prices could still rise 70% to 140% in 2027.
A memory industry research report from TrendForce points out that major global cloud service providers (CSPs) are accelerating their AI infrastructure deployment, with capital expenditures projected to grow 98% year-over-year in 2026 and maintain a 50% growth rate in 2027.
As AI infrastructure investments continue to expand, memory's share of CSP capital expenditure has increased significantly. TrendForce projects that DRAM and NAND Flash combined will account for 47% of CSP capital expenditure in 2026, rising further to 68% in 2027. This means that by 2027, out of every 100 yuan of capital expenditure by CSPs, approximately 68 yuan will be allocated to DRAM and NAND Flash.
The rapid increase in memory spending's share is primarily driven by both rising memory contract prices and growing demand from server applications. TrendForce data shows that server DRAM contract prices rose a cumulative 64% in the second half of 2025 and are expected to surge further by about 270% in 2026; enterprise SSD contract prices rose about 35% in the second half of 2025 and are projected to rise a cumulative 235% in 2026.
In addition, although some long-term agreements signed starting from the second quarter of 2026 set price caps that may limit further upside, TrendForce expects HBM contract prices could still rise 70% to 140% in 2027, with overall memory contract prices remaining at high levels.
Meanwhile, shifts in supply structure are also exacerbating memory cost pressures. TrendForce projects that HBM and RDIMM together will account for 51% of total DRAM bit supply in 2026, indicating suppliers are prioritizing their limited capacity for server-related applications. By 2027, as process node transitions progress and some new fabs ramp up production in the second half of the year, the combined bit supply of server DRAM and HBM is expected to grow by 27%.
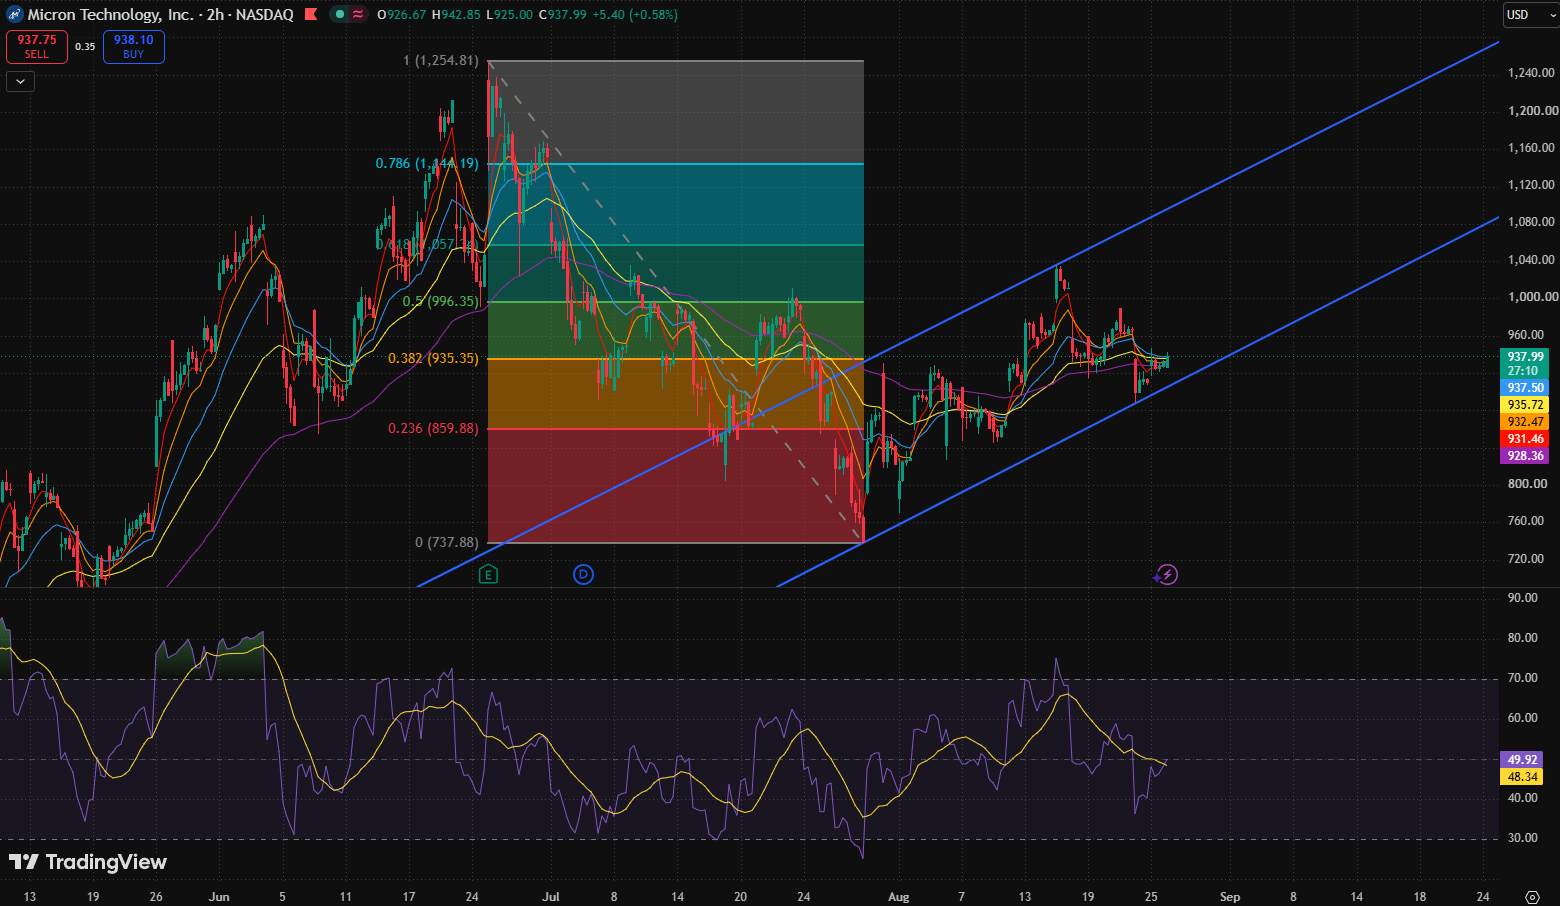
Micron two-hour stock chart, Source: TradingView
Looking at Micron's stock chart, the current price is slightly above the 0.382 Fibonacci retracement level ($935.35), but remains significantly below the 0.5 Fibonacci retracement level ($996.35). The five moving averages in the chart are concentrated in the range of approximately $928.37 to $940.24, with the current price hovering near this dense moving average cluster, indicating a short-term tug-of-war between bulls and bears. Therefore, the current structure represents a high-level consolidation and direction-seeking phase following the rebound near $737.88.
After finding a temporary bottom near $737.88, the stock price formed higher lows and trended upward within an ascending channel. Although the price pulled back after spiking above $1,000 earlier, it remains within the ascending channel, suggesting the medium- to short-term rebound structure has not been completely broken.
Regarding moving averages, all five moving averages are clustered near the current price, indicating that the moving average system has shifted from prior divergence to convergence. Convergence of moving averages typically signals weakening trend momentum and that the market has entered a direction-seeking phase: if the price holds above the moving average cluster and breaks out above $996.35, the rebound structure may re-accelerate; if the price falls back below the moving average cluster, the current movement is more likely to turn into a pullback within the channel.
On the upside, if the stock price convincingly breaks out and holds above the 0.5 Fibonacci retracement level ($996.35), the next level to watch would be the 0.618 Fibonacci retracement level (around $1,057.35), while monitoring resistance near previous highs. On the downside, if $935.35 is breached, the price could retest the lower boundary of the ascending channel and the 0.236 Fibonacci retracement level ($859.88).
Nothing in this material constitutes investment advice, personal recommendation, investment research, an offer, or a solicitation to buy or sell any financial instrument. The content has been prepared without consideration of your individual investment objectives, financial situation, or needs, and should not be treated as such.
Past performance is not a reliable indicator of future performance and/or results. Forward-looking scenarios or forecasts are not a guarantee of future performance. Actual results may differ materially from those anticipated.
Mitrade makes no representation or warranty as to the accuracy or completeness of the information provided and accepts no liability for any loss arising from reliance on such information.
Recommended Articles


