



Amazon Stock Breaks Trendline as AWS Growth and $220B AI Spending Drive AMZN
TradingKey - On August 31, Amazon hovers around $266.43 after breaking a short-term descending trendline and recovering the 38.2% Fib level at around $263.95. While the Fib level was previously a resistance area, it is now a support. This is bullish, and it is further strengthened by solid fundamentals. AWS accelerated 37% growth, advertising remains a high-margin contributor, and Amazon is reportedly planning approximately $220 billion in capital spending this year, largely for AI infrastructure. The biggest question is if this spending on AI balances and continues to stimulate cloud growth and also alleviates the pressure on free cash flow.
AWS Growth Reaccelerated to 37%
AWS delivered its strongest AWS growth at 37% in more than four years, reaching $42.2B in Q2. Backlog grew to around $496B, and management indicated that demand still outpaces capacity. Amazon extends its AI portfolio to include AI training, inference, agents, databases, and security. Amazon’s initiatives aim at improving the economics of AI workloads, and the company is already using Graviton, Trainium, and Inferentia.
Improved Operating Income
Q2 operating income reached $27.5B, which is a good proxy for cleaner profits compared to the headline EPS. The rest of Amazon's reported earnings were impacted by $53.4B of non-operating pre-tax income, primarily tied to its Anthropic investment which distorted Amazon’s reported earnings. That profit should not be considered recurring operating profits.
$220 Billion Capex Is the Core Debate
For 2026, Amazon increased its capital expenditure budget to around $220B, and the new budget focuses on data centers, servers, networking, AI chips and power infrastructure. Management argues that the spending is demand-related, but it is clear that the capacity constraint in the cloud is preventing growth.
There's a cash flow trade-off here. Free cash flow was negative at approximately $7.6 billion in the last 12 months. Amazon Web Services (AWS) is growing in the mid-30% range. If Amazon continues to grow and investors see that growth, they may be able to justify the spending. On the other hand, if growth slows, the market could lose faith and think Amazon is overbuilding.
Advertising and AI Agents Add Higher-Margin Growth
Amazon's Q2 advertising revenue increased by 26% year on year to $19.8 billion, giving Amazon another high-margin engine alongside AWS and contributing to high margin growth. Data on retail customer traffic and purchase intent allows Amazon to profit from the myriad of ways it can engage with customers -- through advertising, Prime memberships, e-commerce, and logistics.
AI agents continued to evolve. Persistent runtimes for production agents had Amazon Bedrock AgentCore upgraded. DynamoDB added real-time vector search. Additionally, Amazon built integration bridges to incorporate the security tools of AWS Continuum in workflows involving Anthropic Claude Code, OpenAI Codex, and Kiro as AWS further develops its presence in the software and security layers of AI.
Zoox and Model Partnerships Add Optionality
Zoox, an Amazon-owned company, began charging for robotaxi rides in Las Vegas during August, after the U.S. approved the company to deploy vehicles lacking standard control control systems. Although Zoox is not currently relevant for earnings, the company creates the option value for future services.
Moonshot AI has been in talks with Amazon, Microsoft and Google to host its Kimi K3 model for revenue-sharing engagements, however, no deal has been confirmed, and this remains a potential catalyst.
Macro Risk Is Rising Into September
On August 31, Brent crude moved above $90, with the escalating tensions in the Gulf and a rise in Treasury yields. Markets were pricing in a September Federal Reserve rate hike after hawkish comments from Fed Chair Kevin Warsh. Higher yields drive growth stocks down, and capital intensive AI will become even less attractive.
This suggests that strong fundamentals of Amazon may not result in a straight-line rally. How investors will continue to factor in the AI-capex story may depend on the latest US labor data and Treasury yields.
Amazon Technical Analysis: $272.91 Is the Next Test
Considering the 2-hour chart with the provided Amazon data (AMZN) at $266.39, live market data at $266.43, and the technical analysis still valid, Amazon has cleared a descending trendline and the 38.2% Fibonacci retracement level at $263.95.
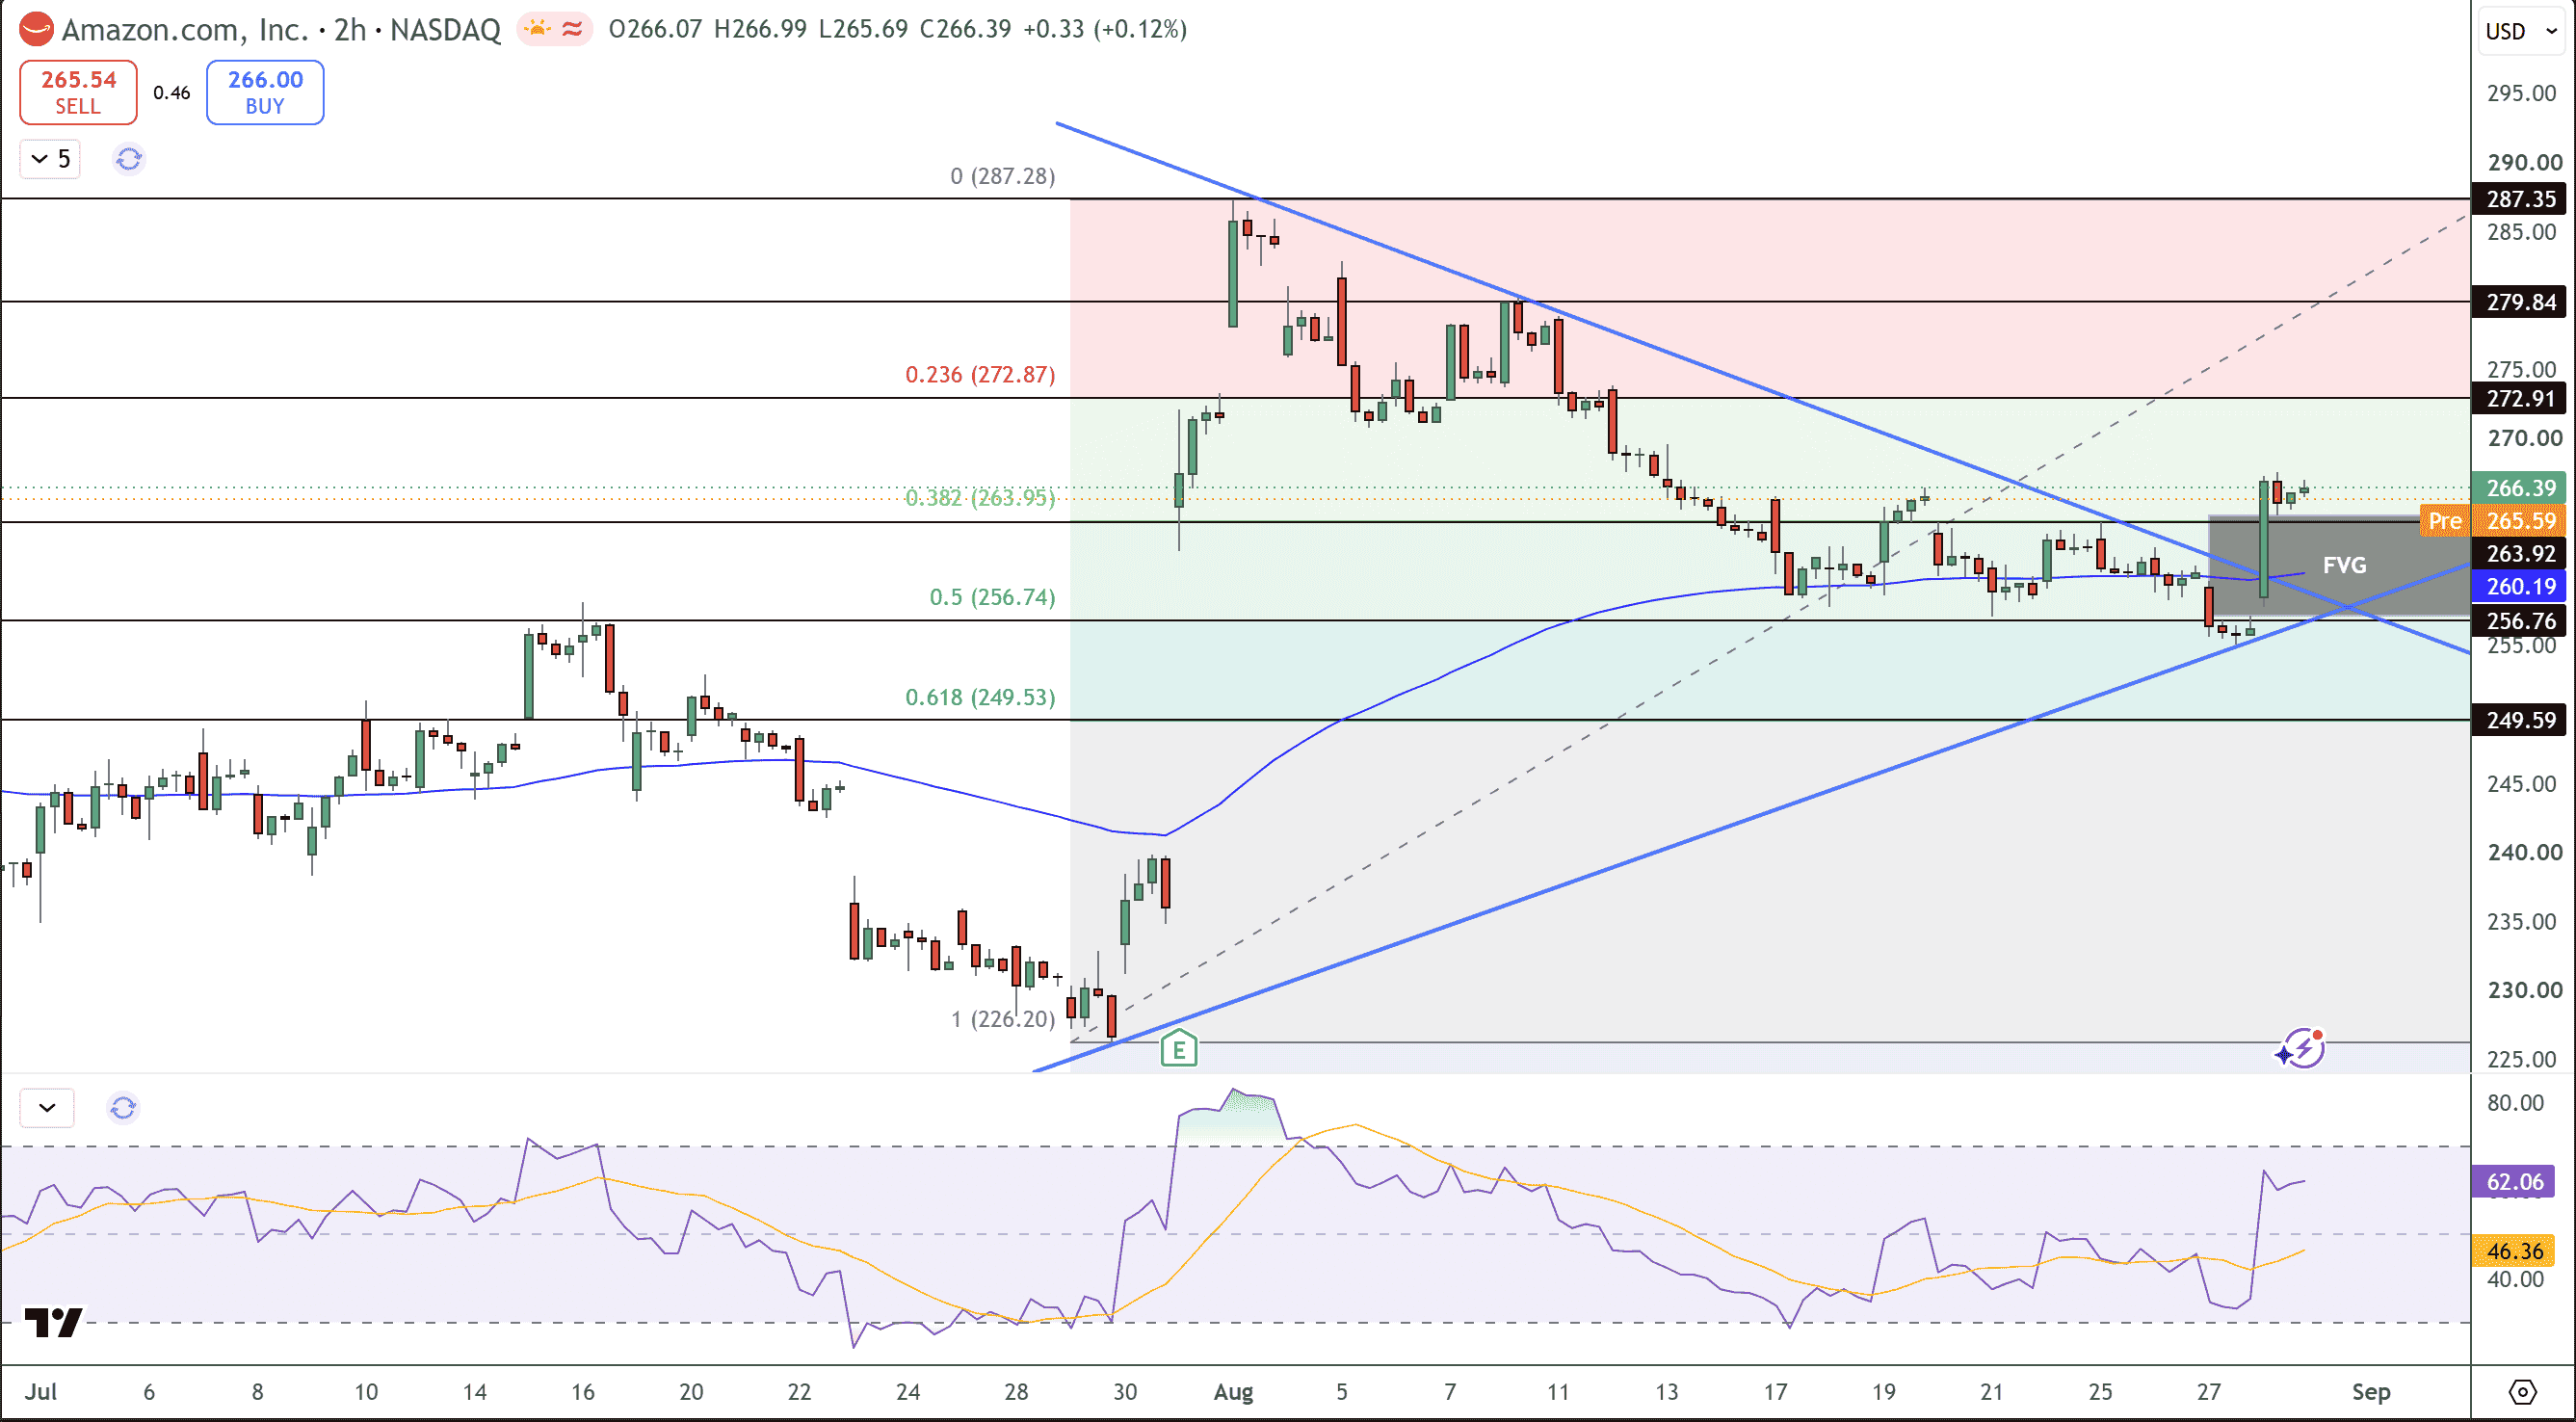
Amazon Stock Price Chart - Source: Tradingview
If Amazon stays above $263.92 - $264.00, the breakout will be valid, and the focus will shift to the next resistance level at $272.87 - $272.91. A move above this level will focus attention on the level at $279.84, followed by the previous high at $287.35. RSI still remains at 62, showing some positive momentum, and has not exceeded the overbought level at 70.
A failure of the breakout will focus attention on the next support level at $260.19, followed by $256.74. A break of this level will weaken the bullish structure and focus attention at the support level of $249.59.
Key Levels
· Current price: $266.43
· Immediate pivot: $263.92 - $264.00
· First support: $260.19
· Major support: $256.74
· Breakout target: $272.91
· Higher targets: $279.84 and $287.35
· RSI: Around 62, bullish but not overbought
Why is Amazon stock rising?
The rise in AMZN has been attributed to strong demand for Amazon Web Services (AWS) and the growth of Amazon’s AI infrastructure. The company sustained a 37% growth in cloud services in the second quarter of this year, and the company has strong capital investment to continue to grow.
What is the biggest risk for AMZN now?
The main risk to AMZN is the company’s $220 Billion capital spending plan. If strong demand for AWS continues, the capital spending program could be justified. However, if the demand for cloud services weakens and yields on U.S. Treasuries remain high, investors will become increasingly less tolerant of negative free cash flow.
Bottom Line
Amazon begins the month of September with a compelling growth story amongst other tech heavyweights. First, AWS accelerated, and advertising is still an effective second engine. Additionally, Amazon is expanding its AI strategy across several fronts including agents, databases, security, and custom silicon. As with most of the tech giants, this creation of new growth streams comes at a hefty cost. In addition to the heavy capital outlays, AMZN is still capital intensive, and thus, remains stocks at risk from cloud execution and changes in the rates charged by lenders. Technically, Amazon remains in a constructive position above $263.92. $272.91 will be the next level of resistance, and $260.19-$256.74 will be the level of support and must hold.
Nothing in this material constitutes investment advice, personal recommendation, investment research, an offer, or a solicitation to buy or sell any financial instrument. The content has been prepared without consideration of your individual investment objectives, financial situation, or needs, and should not be treated as such.
Past performance is not a reliable indicator of future performance and/or results. Forward-looking scenarios or forecasts are not a guarantee of future performance. Actual results may differ materially from those anticipated.
Mitrade makes no representation or warranty as to the accuracy or completeness of the information provided and accepts no liability for any loss arising from reliance on such information.
Recommended Articles


