


Silver is used in solar panels, electronics and cars. Many industries depend on this commodity, and that is unlikely to change much by 2030.
This demand is one of the factors influencing silver prices. At the same time, silver is expensive, and more and more manufacturers are working to use less of it.
In this latest silver price forecast, we show you how silver could develop in the market, which scenarios are conceivable through 2030, and what could push the price higher or lower.
At a Glance: Silver Price Snapshot
Figure for informational and illustrative purposes only. Sources: Mitrade EU, FXStreet data (3 November 2026), WisdomTree (22 October 2026), World Bank, Pink Sheet and Commodity Markets Outlook (October 2026).
Silver Price in 2026: Latest Developments and Forecasts
Silver enters this forecast after a year that has already seen an extraordinary rise and a sharp fall. On 29 January, one troy ounce cost more than US$121. That record did not last long.
Monthly averages are more meaningful. World Bank commodity price data show that the London silver price averaged US$92.1 per ounce in January 2026. By October, it was only US$57.0.
Take a look at the chart below (these are monthly averages, not record highs):
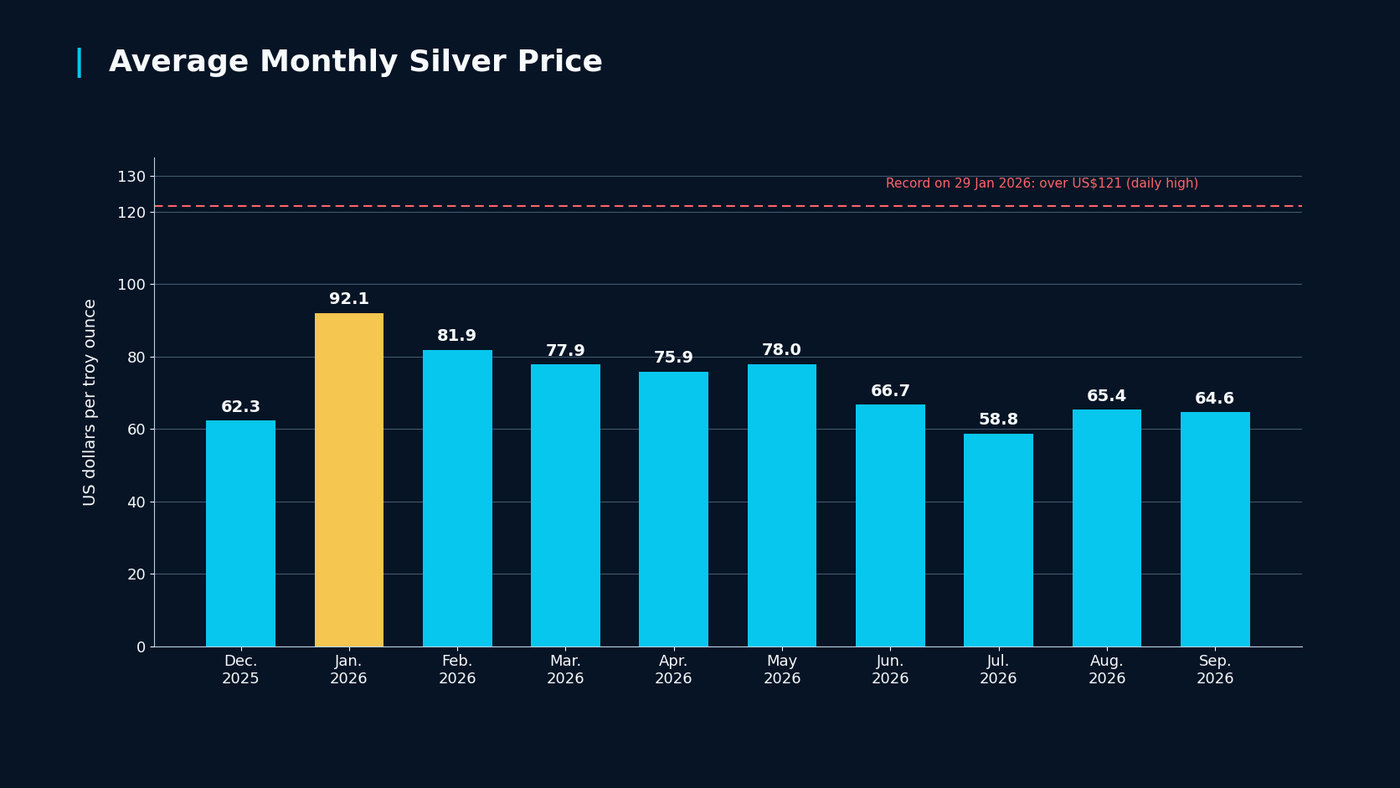
Average monthly silver prices since 2020
Then came January 2026 and, with it, a frenzy. On 29 January, silver reached a record high of more than US$121 per troy ounce. The next day came the crash: the futures contract lost around 31% in a single trading day, its biggest one-day loss since 1980.
Anyone buying silver in January paid an average of around 38% more than in October. Viewed from some distance, the roller-coaster ride becomes clear. In January 2025, the average was US$30.4, almost half the October 2026 level. In other words, the market first surged before correcting again.
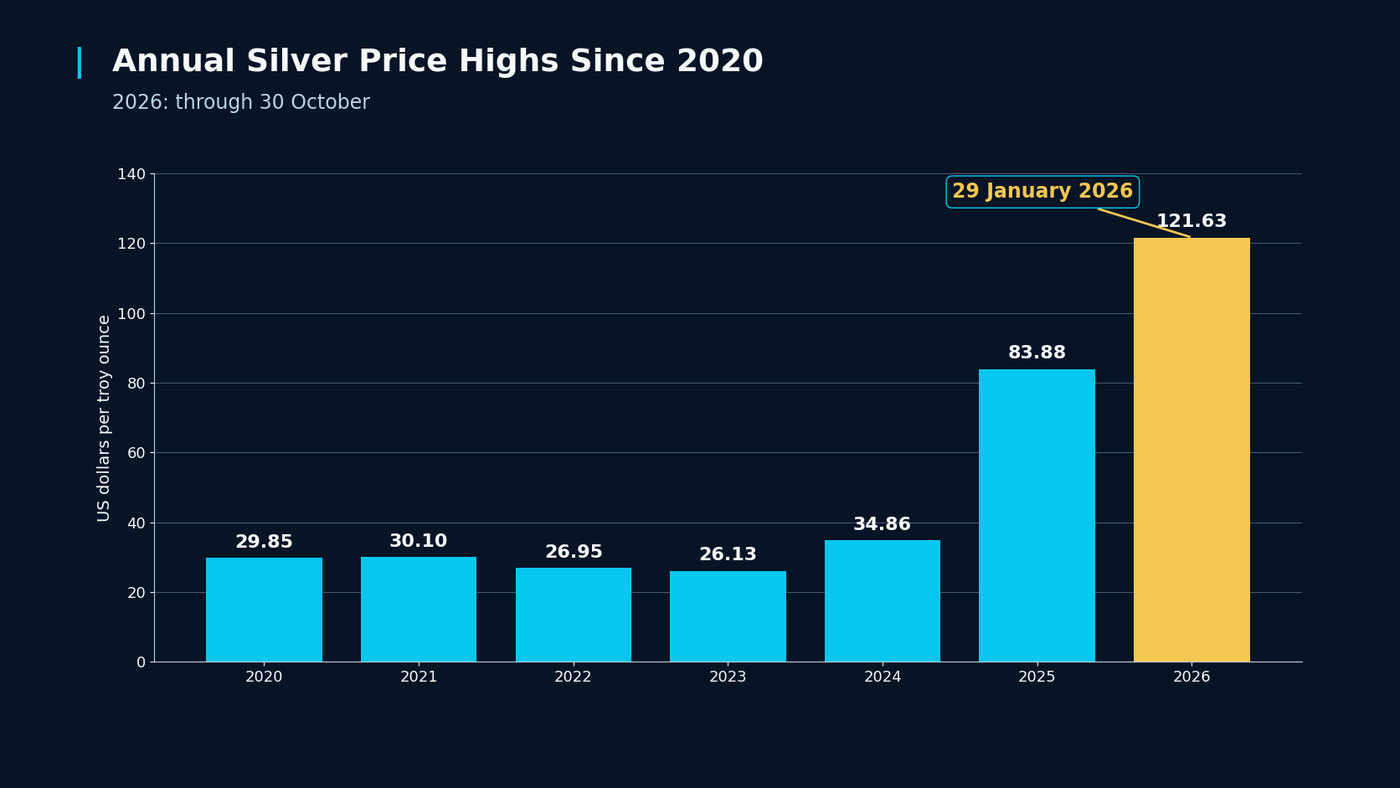
Annual silver price highs since 2020
Since then, the price has moved lower in waves. The monthly average fell from US$92.10 in January to US$64.60 in September. On 3 November, silver traded at US$48.77.
Good to know:
When an asset rises sharply during an extreme price rally and subsequently returns to its original starting point through a full correction, economists often refer to this as a “round trip” or the bursting of a classic market or speculative bubble.
Looking at the silver market between 2024 and November 2026, the metal has completed a monumental and historically unprecedented “round trip”.
Silver Price Forecast 2027–2030: Three Possible Scenarios
The interaction of these forces produces several plausible paths. The following scenarios are based on estimates. They are not predictions of future prices, and no probability is assigned to any scenario.. The starting point is the market in autumn 2026.
1. Upside Scenario: Silver Follows Strong Gold Prices
Gold recovers, interest rates fall and the dollar weakens. Investors return to silver ETFs and physical bars. At the same time, electrification keeps lifting consumption, even as manufacturers use less silver per product. Supply remains tight because output from silver mines needs to keep pace with demand, and new projects take years. Industry and investors then compete for a limited quantity of the metal.
In this scenario, silver would be closer to the upper end of the forecasts. The highest reference point mentioned is UBS’s target of US$80 for September 2027.
What argues against it: High prices accelerate efforts to save silver in industrial use. Most of the time, this effect begins at around US$60. And the shortage must not become too extreme. As seen in late 2025 and January 2026, this very shortage can trigger a price fall: first it attracts speculators, then higher margin requirements on futures exchanges and forced selling follow.
2. Base Scenario: Recovery with the Brakes On
Silver gradually rises alongside gold, while industry acts as a brake. Industrial activity grows, but material savings offset much of the additional demand. Recycling increases, mine production rises slowly and investors buy more at some times and less at others. Silver continues to experience rallies and corrections; it does not rise uninterrupted through 2030.
This broadly matches the centre of most forecasts: US$62 to around US$70 in 2027 (World Bank, Reuters survey and WisdomTree). However, placing this scenario in the middle does not demonstrate that it is more likely than the other two.
What would invalidate it: another speculative surge like January 2026, or a sharp economic downturn.
3. Downside Scenario: Industry Pulls Back
The solar industry continues to reduce its silver use faster than its production grows. Recycling expands, interest rates stay high and the global economy weakens. A strong dollar makes silver less attractive to investors. If holders sell into this weaker market, the price could fall even as solar installations continue to be built worldwide and electricity consumption rises.
In that case, the World Bank’s projected path becomes relevant: it expects an annual average of just US$58 as early as 2028. The 2025 average of US$39.80 shows where silver stood before the boom.
Silver Prices and Growth to 2030: Factors Driving the Market
Silver has two types of buyers. Some need it for their products, while others want to own it. Both draw on the same available supply, but make their decisions using very different criteria.
How Companies Influence the Silver Forecast to 2030
Companies and industrial sectors exert a direct influence on the silver outlook through 2030. Since more than 50% of silver is used in industry, major corporations in green technologies, artificial intelligence, and mining are especially influential in determining future price trends.
Let us take a closer look at the drivers of the silver price forecast:
The Most Important Industrial Drivers and Their Impact
Solar Industry (Photovoltaics): Solar companies are the strongest drivers of demand. The EU alone aims to reach 700 gigawatts of solar capacity by 2030. Because silver reflects light exceptionally well, the solar industry could claim as much as 94% of global silver production by 2030.
Artificial Intelligence and Technology Companies: AI data centre operators need extremely powerful chips and server components. Silver has the highest electrical conductivity of any metal and is widely used in electrical applications. However, alternative materials (such as copper) may be used in some applications as manufacturers seek to reduce costs.
Automotive Industry and Electric Mobility: Car manufacturers use around three ounces of silver per electric vehicle. The transition to solid-state batteries and the expansion of charging infrastructure add further to demand.
Energy Industry: Electricity, Climate and Data Centres
Silver conducts electricity better than any other metal, which is why it is used in electrical contacts, electronics and solar cells. According to the Silver Institute’s estimate, industry consumed around 657.4 million troy ounces in 2025, about 58% of total demand.
Rising Electricity Demand Through 2030
According to the International Energy Agency (IEA) report Electricity 2026, global electricity consumption will grow by an average of 3.6% annually from 2026 to 2030. Drivers include industry, electric cars, air conditioning and data centres. Higher electricity consumption means more power plants, power lines and grids.
Impact on silver price: high
Impact through 2030: potentially significant
Pressure through 2030: many companies are looking for cheaper alternatives
Copper Instead of Silver in Solar Cells
A September 2026 study from the IEA Photovoltaic Power Systems Programme (PVPS) identifies copper as a substitute for silver in solar-cell conductors, which could significantly reduce silver demand in the future. The study also sees potential to recover silver from end-of-life panels. However, its modelling extends to 2050. It is not possible to infer from this how much recycled silver will reach the market by 2030
What Risks Could Change the Forecast?
Forecasts become outdated quickly. These five developments could overturn any of the scenarios:
Speculation: The silver market is relatively small. Individual waves of investment money can move prices substantially, as illustrated by the daily loss of around 31% in January 2026.
Monetary policy: A more restrictive US Federal Reserve, with further interest-rate increases, is currently seen as a risk.
Economy and energy: High energy prices and geopolitical tensions, such as the Iran war, weigh on industry.
Technology: If the solar industry succeeds in replacing silver with copper on a large scale, part of demand would be lost permanently.
Policy: New tariffs or export rules could channel silver back into particular storage locations and create shortages elsewhere.
Why Has the Silver Price Fallen So Sharply?
hysical market shortages contributed to the sharp price movements.. In late 2025, an enormous supply deficit intensified. Industry (particularly photovoltaics, electric mobility and AI infrastructure) needed gigantic quantities of silver.
When investors began demanding physical delivery of their futures contracts in winter, almost a quarter of the silver stocks at the leading exchange (COMEX) were withdrawn at once. This contributed to concerns about physical silver shortages.
Could Shortages Cause Silver Prices to Fall Again by 2030?
Yes. The silver price could continue to fall structurally through 2030 despite, or even because of, a shortage. What sounds paradoxical is a familiar economic phenomenon in commodity markets: an extreme, persistent shortage sets mechanisms in motion that destroy demand in the long run and artificially expand supply.
Some analysts at trading platforms show precisely this path in their long-term bearish scenarios for 2030 (with forecasts as low as US$35–55 per ounce following periods above US$100). Some forecasting firms view this same factor—scarcity—as a possible cause of another price slump.
Why Does the Silver Price Move?
Silver has two bosses: the gold price and factory floors. Sometimes both pull in the same direction. Often they do not, and that is exactly what makes silver so difficult to predict.
1. Gold Sets the Pace
When gold rises, silver generally follows. UBS strategist Dominic Schnider describes silver as a more volatile version of gold. The correlation between the two metals was near a multi-year high in autumn 2026 (Yahoo Finance, 27 September 2026). Schnider also expects the gold–silver ratio not to stay above 70 permanently.
Current forecasts show that silver does not automatically follow gold. Analysts surveyed by Reuters expect gold to rise by 3.4% to US$4,650 in 2027, while silver is expected to fall by 5% to US$66.75. The World Bank expects prices of both metals to fall through 2028, but predicts substantially greater losses for silver. The reason is the second boss: the factories.
2. Supply and Mines
Silver has a feature that distinguishes it from almost all other commodities. Around 74% of mined silver came from mines that primarily produce other metals: lead, zinc, copper or gold. Silver is only a by-product there.
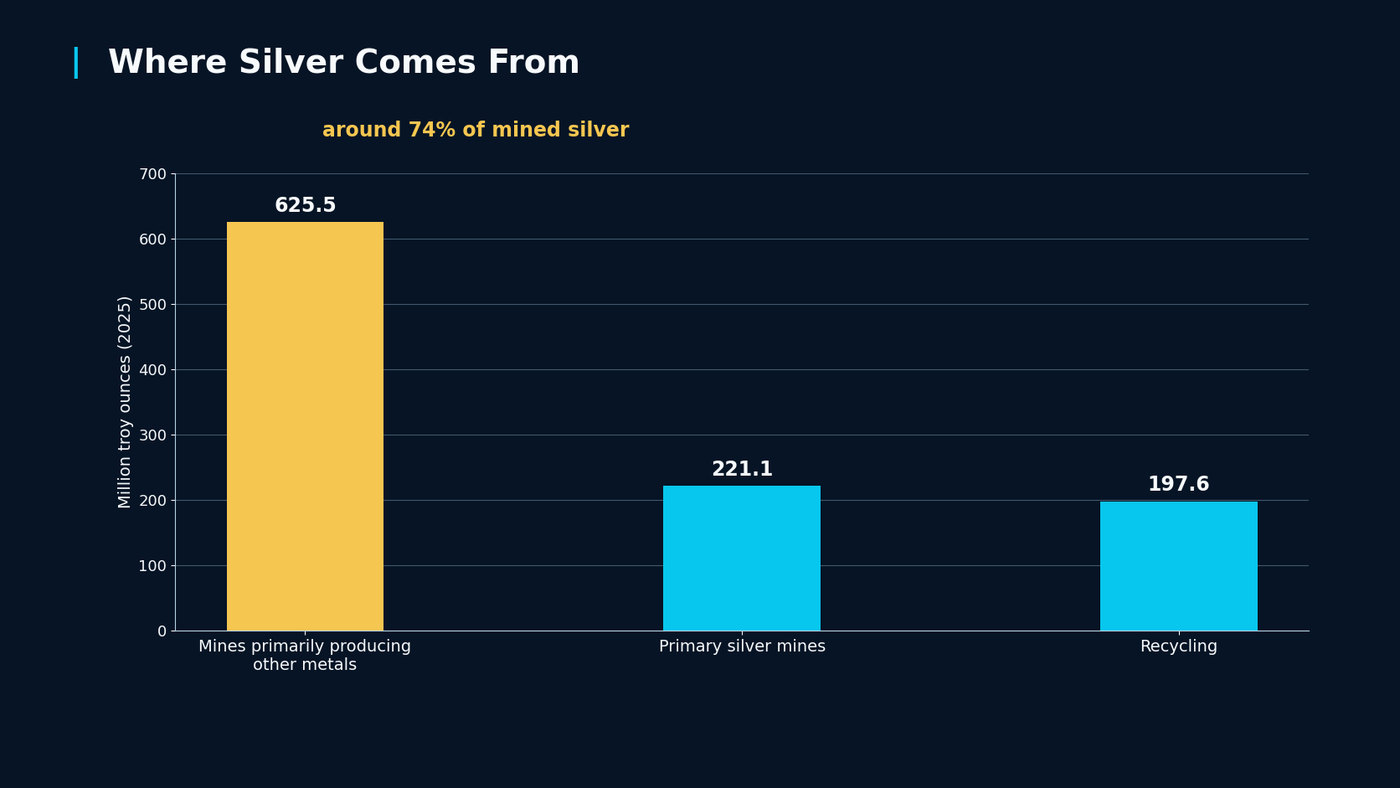
Silver production by source
The result: a high silver price attracts little additional mining. A copper mine does not extract more ore just because silver has become more expensive. Supply reacts slowly. Two years ago, mine output did rise by 3% to 846.6 million ounces, mainly because of copper mines in Peru and a new mine in Russia. In North America, by contrast, production fell to its lowest level in ten years.
3. Industry: Demand with a Built-In Brake
More than half of silver ends up in factories. Industry consumed 657.4 million ounces in 2025, a decline of 3% for the first time after four years of growth. According to Metals Focus, industrial demand will fall a further 3% in 2026 to around 640 million ounces.
One reason is the solar sector: BloombergNEF expects 2026 to see the first decline in new solar installations in almost two decades. In China in particular, many projects were connected to the grid in 2025 before changes to renewable electricity remuneration. Growth in India, the Middle East and Southeast Asia only partly offsets this.
There is also an effect that many underestimate. The more expensive silver becomes, the more creative engineers become at saving it. Manufacturers use less silver in each solar cell or replace it with other metals.
There is a counterweight, however. Electric vehicles, charging stations, power grids and AI data centres also need silver.
What Do Banks and Analysts Expect?
Published forecasts extend from 2028 to 2030. They are surprisingly close together:
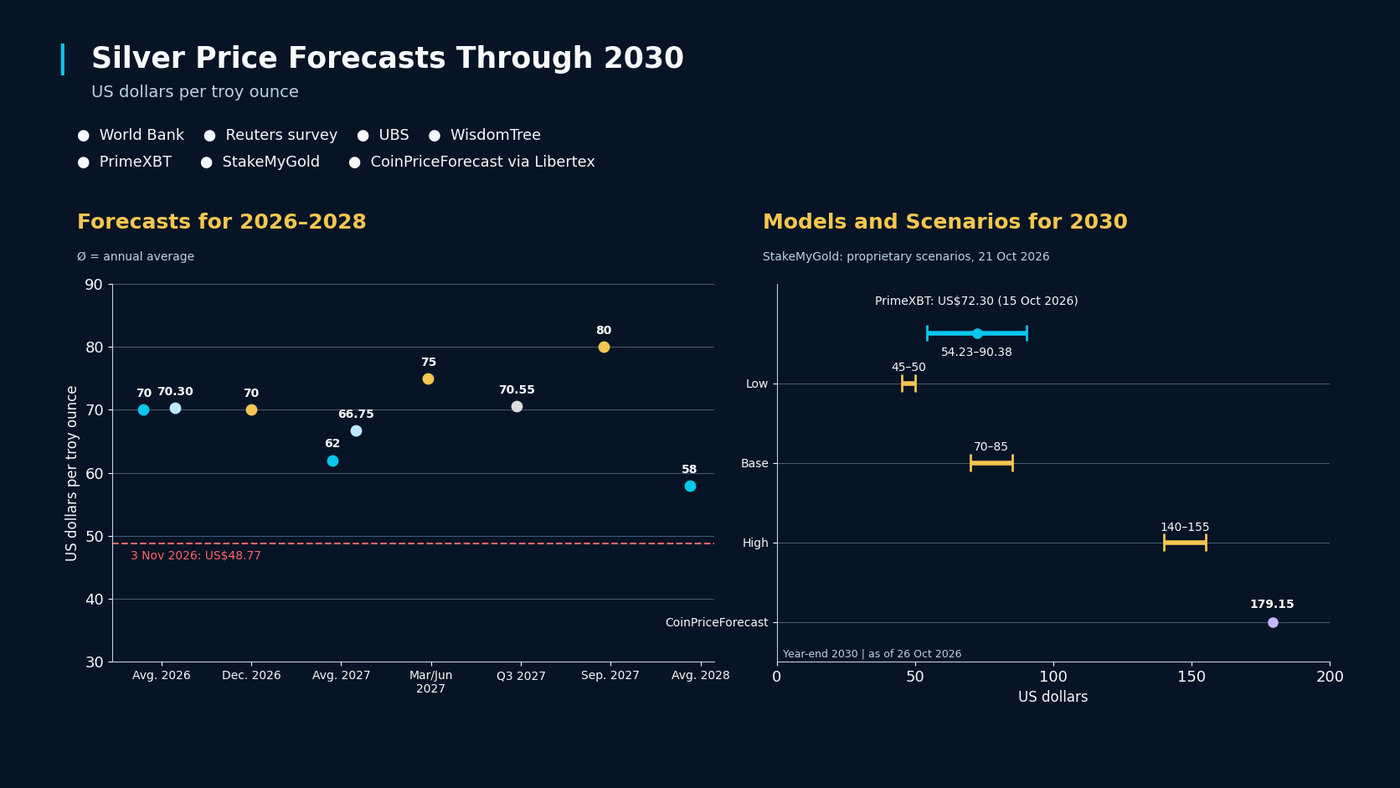
Silver price forecasts through 2030
Forecasts at a Glance
Two things stand out. First, almost all expectations cluster around US$60–80. Second, forecasts are continually being revised down. In February 2026, analysts in the Reuters survey still expected an annual average of US$79.50 for 2026. By late October, it was US$70.30.
Good to know: How to Recognise a Credible Forecast
Date: A forecast without a publication date is worthless. With silver, one month can change everything.
Time horizon: An annual average is different from a price target for a particular date.
Assumptions: Good forecasts explain what must happen for them to materialise. At UBS, for example, these include lower interest rates and stable industrial activity.
Publisher: Traders who sell silver are not neutral sources.
How Is Silver Linked to the Gold–Silver Ratio?
The gold–silver ratio shows how many ounces of silver are needed to buy one ounce of gold. Silver is therefore currently valued relatively low compared with gold. That does not mean silver must rise. A return towards 60 could just as easily happen through a falling gold price.
Silver CFDs: What You Should Know
Silver CFDs allow traders to speculate on rising or falling prices without owning the underlying metal. Trading CFDs is risky, particularly with such a volatile commodity. harp price movements can result in substantial losses, especially when trading with leverage.
Important: Leverage can amplify both gains and losses.. Leverage availability varies by underlying asset. Anyone who wants to understand how CFDs work without using real money can try a free demo account.


 Forex CFDs | Share CFDs | Commodity CFDs | Index CFDs
 Authorized and regulated by CySEC (Licence No. 438/23)
 No commission and competitive spreads*
 Leverage up to 1:30 for retail clients
 Technical analysis powered by Trading Central
 Real-time market insights and data updates
 24/7 multilingual customer support
 Available on web and mobile app
What Could Silver Be Worth in 2030?
The published forecasts end in 2027 and 2028 and range between US$58 and US$80 per troy ounce. Where silver stands in 2030 will depend on several factors, including the gold price, industrial demand and interest rates.
Will the Silver Price Explode?
Nobody can reliably predict that. January 2026 showed how quickly prices can move in both directions. Silver first climbed to a record above US$121, followed by a daily loss of around 31% just one day later. The published forecasts are considerably more restrained.
What Role Does Industrial Demand Play?
A central one. According to the World Silver Survey 2026, industrial use accounted for 657.4 million of the 1.13 billion ounces of silver demanded in 2025, or around 58%. Because manufacturers economise when prices are high, this demand also acts as a brake.
What Could Invalidate a Silver Price Forecast?
On the downside: rising interest rates, a recession or the rapid replacement of silver with copper in solar cells. On the upside: persistent supply deficits, a strong gold rally or a new wave of investor buying. Forecasts are snapshots, not promises.
Disclaimer: The content provided is for informational purposes only and does not constitute investment advice, a personal recommendation, or an invitation or inducement to buy or sell financial instruments. It has been prepared without consideration of your personal investment objectives or financial situation. No representation or warranty is made regarding the accuracy or completeness of the information. References to past performance or future projections are not reliable indicators of future performance.


