



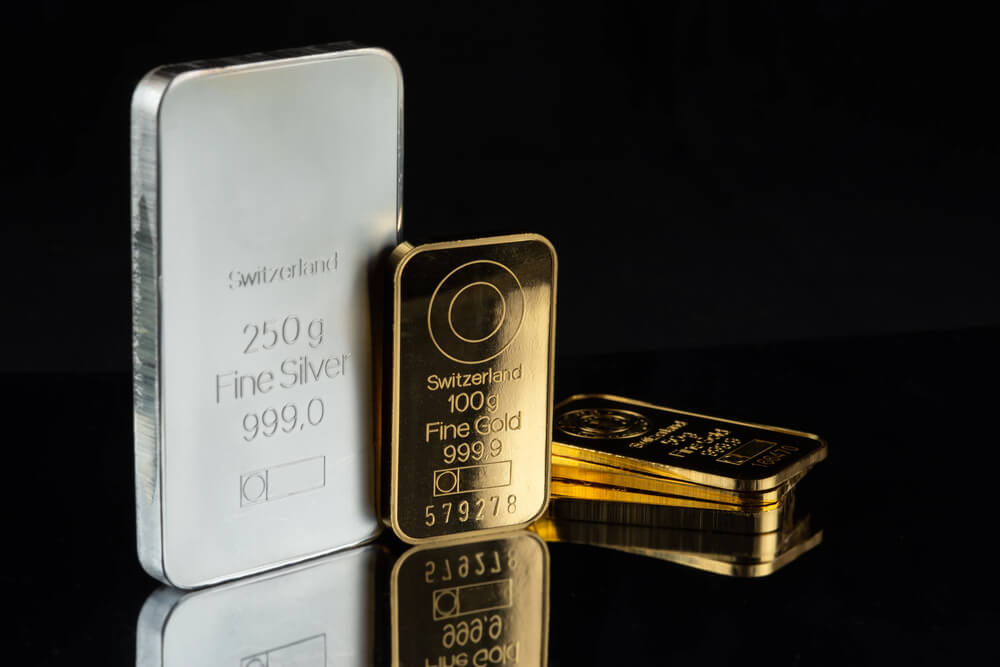
A high gold-silver ratio means gold is relatively expensive compared with silver, while a low ratio means gold is relatively less expensive compared with silver. Whether a reading is high or low depends on the historical period used for comparison.
But when is a reading actually “high” or “low”? That is a matter of interpretation and depends entirely on the historical period used as a benchmark.
We show the current gold-silver ratio, explain how to calculate it and discuss what it says about the market.
Snapshot: The Gold-Silver Ratio at a Glance
Metric | Current figures | Current interpretation |
Gold-silver ratio | Approx. 77.7–79.1 | One ounce of gold is worth around 78 ounces of silver. |
Ratio vs. 2-year comparison | 79.0 vs average 77.7 | Gold is currently slightly more expensive than over the past two years. |
1-month change | Approx. +15% | The ratio has risen significantly over the past month. Silver has weakened. |
Change since start of year | Approx. +31% | Gold has clearly outperformed silver so far in 2026. |
2-year high | Approx. 104.7 | At times in the past two years, gold was much more expensive. |
2-year low | Approx. 45.7 | Silver had periods of significantly stronger relative performance. |
Average since 1968 | Approx. 59.1 | The average is well below the current reading. |
Median since 2000 | Approx. 68 | The ratio is also currently elevated relative to the median since 2000. |
What Is the Gold-Silver Ratio?
The gold-silver ratio compares the prices of gold and silver. It indicates how much more expensive gold is than silver. Another way of asking the question is: “How much silver does one ounce of gold cost?”
The answer is that the gold-silver ratio shows how much silver you need to buy one ounce of gold.
This lets us see whether gold is becoming more expensive or cheaper relative to silver. It helps explain the relative price performance of the two precious metals over time.
How Is the Gold-Silver Ratio Calculated?
The calculation follows a simple formula. If gold is priced at $2,500 and silver at $40, you divide 2,500 by 40. The result is 62.5. You need 62.5 ounces of silver for one ounce of gold.
Take a look at the example in the image:
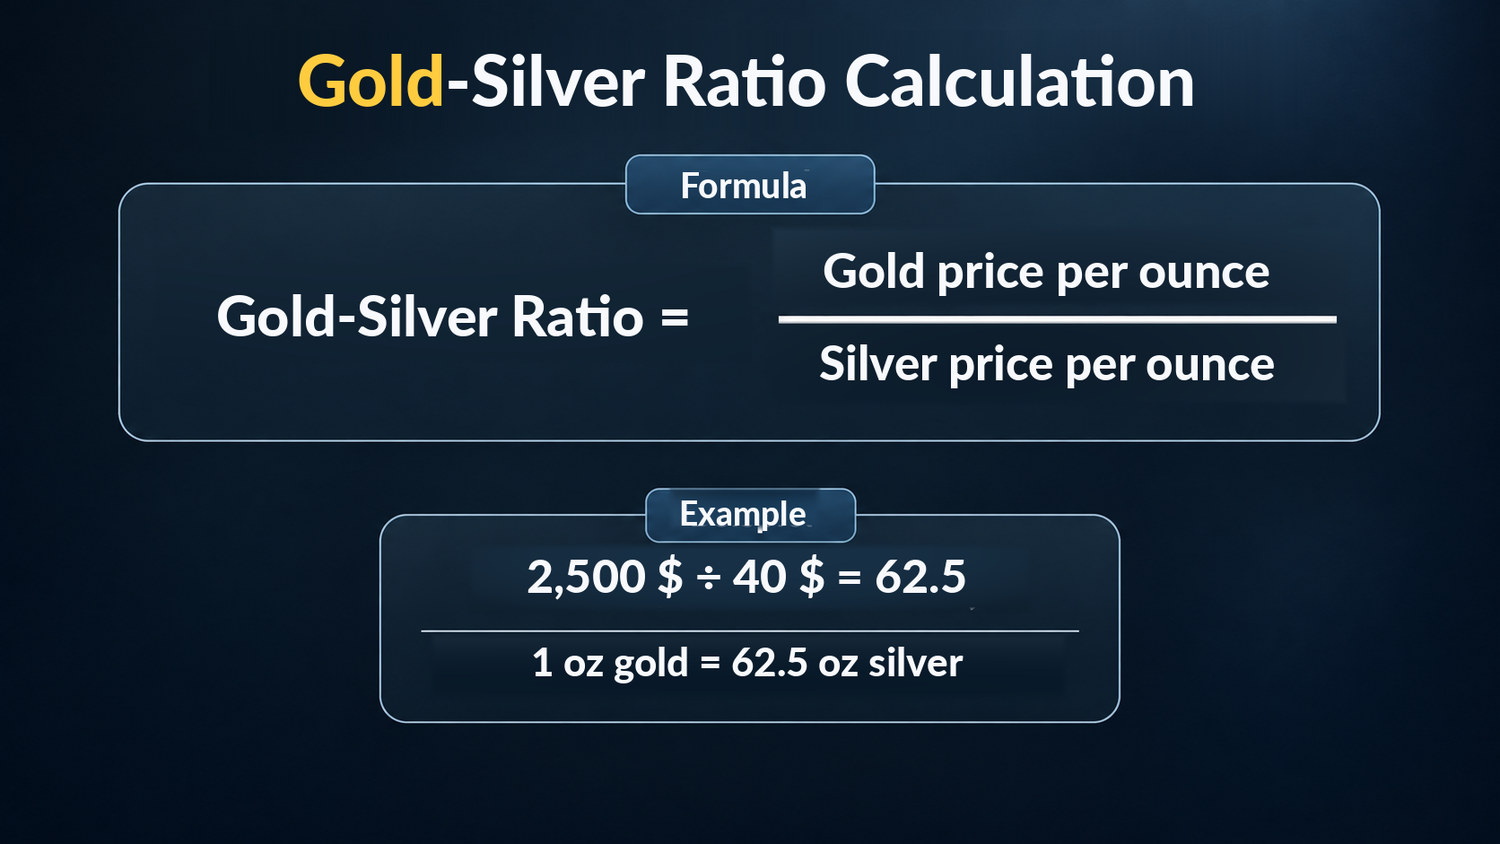
Example calculation of the gold-silver ratio
The Formula: How to Calculate the Gold-Silver Ratio
Divide the current gold price by the silver price.
Example: Gold costs $2,500 and silver costs $40.Result: 2,500 ÷ 40 = 62.5.
The ratio is 62.5. You need 62.5 ounces of silver to buy 1 ounce of gold.
This ratio provides a useful way to understand how gold and silver prices compare and how their relationship changes over time.
What Does a High or Low Gold-Silver Ratio Mean?
Over the years, we have observed that gold and silver often move in the same direction in the market. However, not always to the same extent. Gold continues to be considered safer, while silver reacts strongly to fluctuations in industry (including the markets for solar, electronics and batteries). Therefore, silver can rise faster during periods of economic expansion, but also fall more sharply in crises.
The ratio therefore also indicates which metal is relatively expensive and which is relatively cheap:
Ratio | Interpretation from the ratio |
Low, roughly below 50 | Silver is relatively more expensive compared with gold. |
Medium, roughly 50–80 | Illustrative historical range; depends on the selected period. |
High, roughly above 80 | Gold is relatively more expensive compared with silver. |
The gold-silver ratio can offer useful insights into how the two precious metals perform relative to each other. A higher or lower reading may indicate a shift in their relative price relationship.
Very high ratio: Silver is relatively less expensive than gold, meaning that more ounces of silver are needed to match the value of one ounce of gold.
Very low ratio: Gold is relatively less expensive than silver, meaning that fewer ounces of silver are needed to match the value of one ounce of gold.
Trading the ratio: Some traders monitor changes in the ratio when analysing the relative performance of gold and silver. However, the ratio alone does not determine the direction of either market.
When trading, remember that a high ratio does not guarantee a rise in silver. It may also mean that gold continues rising during periods of market uncertainty while silver remains weak. The ratio describes only the relationship between the two metals, not whether either will rise or fall.
How Has the Gold-Silver Ratio Developed Historically?
The gold-silver ratio used to be far lower than today. In the nineteenth century it was generally around 15:1 to 16:1 because many countries linked gold and silver by law. One ounce of gold was thus worth approximately 15 ounces of silver. When silver later lost its former monetary role and gold became the more dominant store of value, the ratio rose significantly.
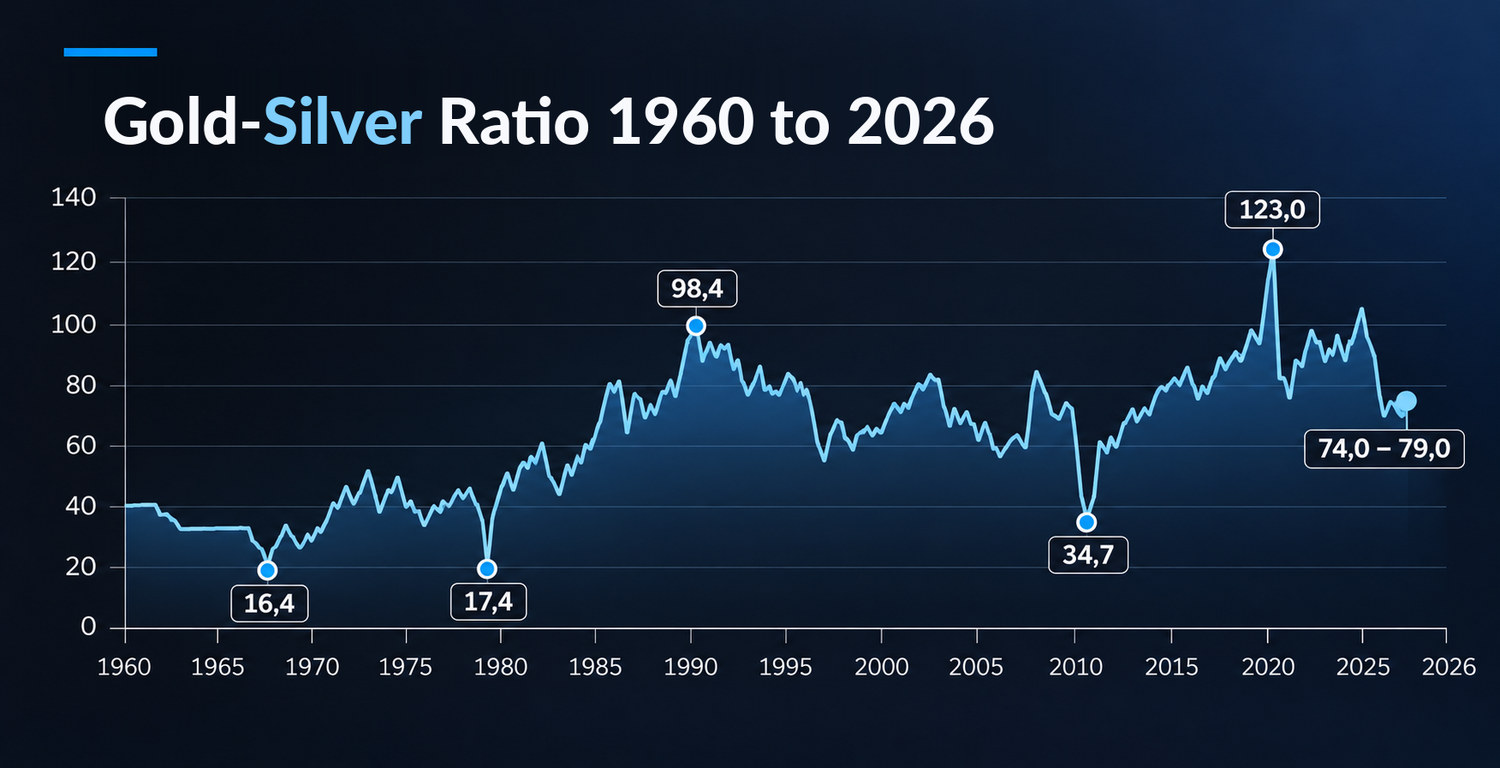
Gold-silver ratio from 1960 to 2026
In the twentieth century, the ratio was broadly between 40 and 80, with occasional extreme movements. The reason is well known. Today, gold has a stronger monetary and crisis-related character, whereas silver depends more heavily on industry and economic conditions.
Look at the following illustration of historical and recent developments:
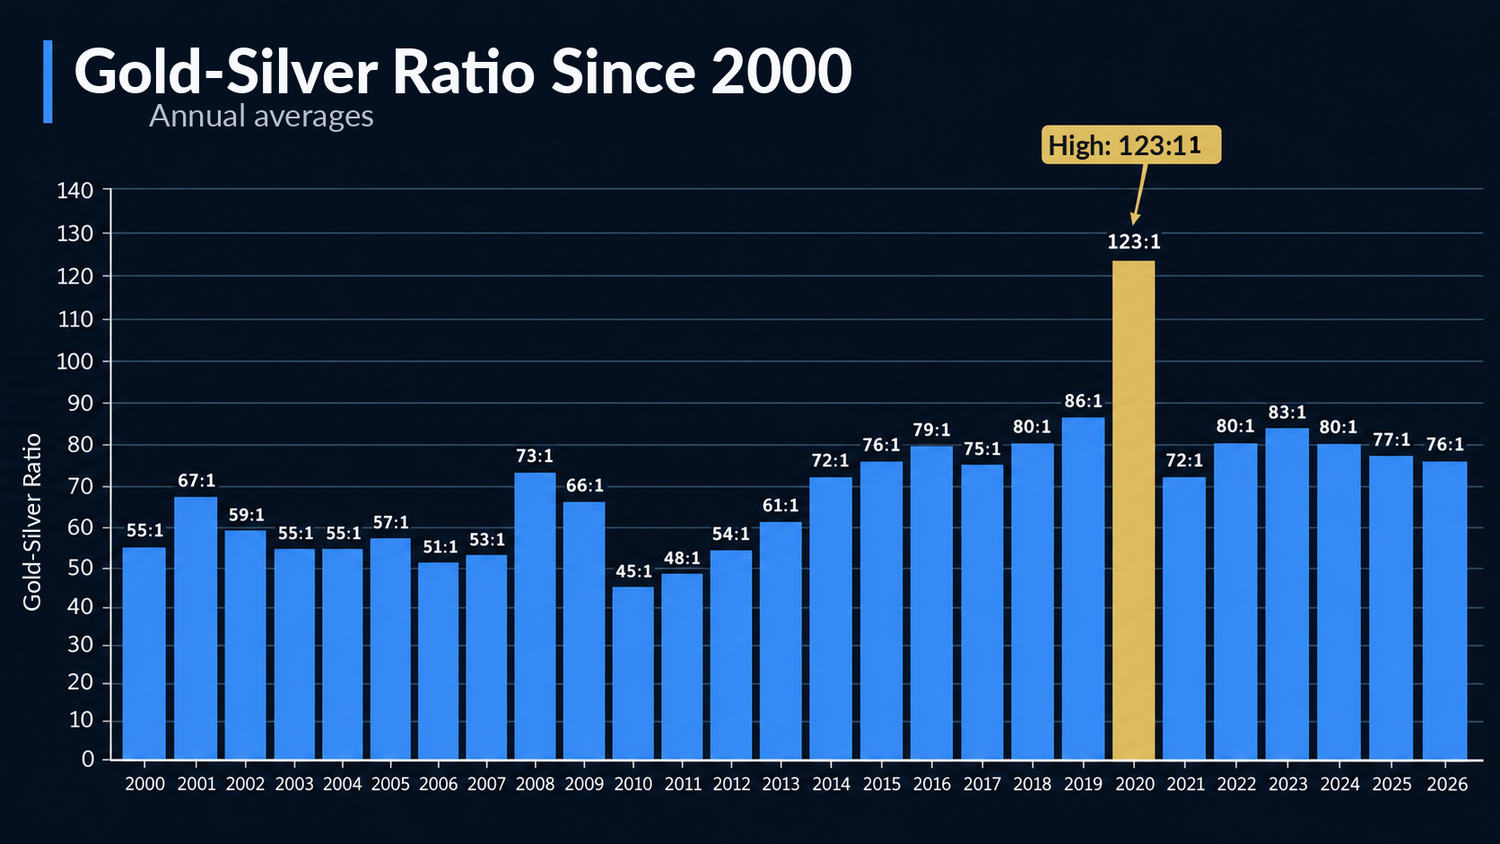
Current and historical gold-silver ratio
The Current Rule of Thumb for the Gold-Silver Ratio:
“Since 1968 the average has been about 59:1; since 2000 it has been about 69:1. This means that values around 60 are relatively low historically, while values above 80 are relatively high.”
Good to know:
To identify undervaluation or overvaluation accurately using the gold-silver ratio (GSR), the current reading alone is not enough. You must compare it with a historical average.
Only this benchmark shows you whether a metal is outside its usual range: A value well above this average (e.g. 80+) signals that silver is undervalued. A value well below this average (e.g. below 50) indicates that gold is undervalued.
What Factors Influence the Gold-Silver Ratio?
The two metals have completely different “personalities”. We must not forget that there are essentially two perspectives: their material utility on the one hand, and the emotional and financial value we attribute to metals such as gold on the other.
Some investors are fully aware of this, while others are not. Ultimately, investor psychology plays an overriding role in price formation. This brings us to the first key factor:
1. How Market Uncertainty Can Affect Gold and Silver
During periods of uncertainty, such as financial crises, wars, banking problems or an inflation shock, demand for gold may increase as some investors consider it a safe-haven asset. However, gold prices can also decline, including during periods of market stress.
Silver may also benefit from this “safe-haven” demand, but its price is influenced more strongly by industrial activity and economic conditions. As a result, silver can experience greater price fluctuations than gold, particularly when economic conditions affect industrial demand.
2. Central Banks Buy Gold and Interest Rates Influence Investment
Gold is widely held as a reserve asset by central banks and is also used for investment and jewellery purposes.. Unlike silver, which has significant industrial applications, gold plays an important role in central bank reserves and is often regarded as a store of value.
In the third quarter of 2026 alone, central banks worldwide purchased a net 321 tonnes of gold. Since the beginning of 2026, the total has reached an enormous 675 tonnes (World Gold Council data). Such purchases can influence demand for gold and contribute to price movements.
Interest rates are another important factor. When real interest rates on savings accounts or government bonds rise, gold may become less attractive to investors because it does not generate interest. Conversely, lower real interest rates may increase demand for gold. However, gold prices are influenced by several factors and do not necessarily move in response to interest rates alone.
3. Silver Is an Important Industrial Commodity
Silver has a double life: It is a precious metal and an essential industrial commodity. Silver is found almost everywhere. According to the Silver Institute’s World Silver Survey 2026, industrial applications consumed 657.4 million ounces of silver in 2025. Out of total global demand of 1.13 billion ounces, this is around 58%. From smartphones and power grids to solar panels, silver is integral to many technologies.
Good to know: Why does silver fluctuate much more sharply than gold?
The reason is the tiny size of the silver market. During the first nine months of 2026, gold transactions worth an astonishing US$566 billion were conducted worldwide. The silver market looks tiny by comparison: Its entire annual demand is worth roughly US$54 billion at prices prevailing in early November.
What Are the Limitations of the Gold-Silver Ratio?
As fascinating as the gold-silver ratio is, it is not a magical compass for guaranteed profits. Remember that it describes a relationship rather than an absolute value. It can rise while both metals fall in price, and decline while both become more expensive.
Anyone trying to forecast future price movements using this metric faces four fundamental problems:
The ratio tells only part of the story: Even if the ratio is historically extremely high and, according to ome historical benchmarks, may move back toward 60, nobody can tell you when that might happen. The ratio can remain at unusually high or low levels for extended periods.
The equilibrium can shift permanently: The “normal value” of the ratio is not set in stone forever. If central banks continue to buy gold or demand for silver changes dramatically due to new technologies, the long-term relationship between the two metals may settle at a different level.
It provides no price target: If the ratio falls, you know that silver is gaining ground relative to gold. But you do not know why. Is silver rising sharply?? Or is gold falling faster while silver remains relatively stable? The indicator says absolutely nothing about the actual level of future prices in euros or US dollars.
Costs and taxes: Anyone wanting to hold real coins or bars and store them in a vault must include the additional costs. Tax treatment is another consideration. Under EU VAT rules, qualifying investment gold is exempt from VAT, while silver is generally subject to VAT, with the applicable treatment depending on the relevant Member State and circumstances.
Why Scarcity Alone Does Not Explain the Price
It might seem logical to assume that gold is far more expensive than silver because it must be much rarer in the world. Yet mine production figures tell a different story.
In 2025, mines worldwide produced 846.6 million ounces of silver (approximately 26,300 tonnes). During the same period, global gold mining produced 3,671.6 tonnes.
For every tonne of gold mined, only a little more than seven tonnes of silver were produced. Yet gold’s market price is many times higher than this 7:1 ratio.
How can this be?
The key lies in what happens to the metals after extraction. Gold is rarely consumed in the same way as many industrial materials.. Much of the gold mined by ancient Egyptians or Incas still exists today, whether as bars in vaults or jewellery.
Silver, by contrast, is used in a wide range of industrial products and applications.. It is found in the tiniest quantities in millions of computers, mobile phones and switches. Because there is so little of it per device, recycling is often not economically worthwhile. In 2025, for example, only 197.6 million ounces of silver came from recycling.
What Role Does the Ratio Play in Gold and Silver CFDs?
Contracts for difference (CFDs) allow clients to speculate on price movements in gold and silver without owning the underlying physical metals. The gold-silver ratio can be used to observe how the prices of these two markets move relative to each other.
Ratio | Meaning | Example investment |
High, around 80+ | Silver is relatively less expensive compared with gold | Tendency toward a long silver CFD |
Low, below 50 | Gold is relatively less expensive compared with silver | Tendency toward a long gold CFD |
Normal range | The relationship is closer to the selected historical benchmark | Wait or use other criteria |
However, this is only a relative filter, not an automatic buy signal. It does not mean that these movements will actually occur in the market. A high ratio does not mean that silver must rise in absolute terms. It only indicates that silver appears relatively inexpensive compared to gold.
What Does a Gold-Silver Ratio of 80 Mean?
At a ratio of 80, you need 80 troy ounces of silver to buy one troy ounce of gold. Relative to the historical average since 1970 this is a very high reading, whereas relative to the past ten years it is entirely normal. The ratio alone cannot reliably forecast future price movements.
What Is a Normal Gold-Silver Ratio?
There is no fixed or immutable normal value in a free market, because the average ranges between 55:1 and 80:1 depending on the historical period selected. The Silver Institute has identified a long-term benchmark below 60 for the period since 1970.
How Often Does the Gold-Silver Ratio Change?
The ratio changes second by second because it is directly linked to live prices of both precious metals. Historically, the monthly average since 1970 has typically changed by around 2.8% from one month to the next. January 2026 showed how significant movements can become, with a 25.4% drop—the steepest monthly fall in more than 50 years.
Can the Gold-Silver Ratio Predict Future Prices?
No, the indicator is not a fortune-teller; it only ever provides a current snapshot of the relationship. Even if the ratio moves back towards its historical average at some point, it remains completely unclear when that will happen and how the target will be reached. An extremely high ratio is therefore never an automatic buy signal for silver, because the gold price could just as easily collapse instead.
Disclaimer: The content provided is for informational purposes only and does not constitute investment advice, a personal recommendation, or an invitation or inducement to buy or sell financial instruments. It has been prepared without consideration of your personal investment objectives or financial situation. No representation or warranty is made regarding the accuracy or completeness of the information. References to past performance or future projections are not reliable indicators of future performance.


