



Bitcoin Price Forecast: Hotter-Than-Expected US Inflation Drags BTC Below $74,000 as Bulls Eye $73,000 Support
TradingKey - On Thursday (November 12), Bitcoin (BTC) continued its recent downward trend. As of today's European trading session, Bitcoin fell below $74,000 intraday, with the latest price trading near $73,600. From a fundamental perspective, rising Federal Reserve rate-hike expectations and persistent ETF capital outflows are the two primary headwinds driving Bitcoin's recent decline.
The latest U.S. October CPI rose 0.4% month-over-month, exceeding market expectations of 0.3%, while core CPI climbed 0.3% month-over-month, also topping the expected 0.2%. Persistent inflationary pressures have further cemented market expectations of a Federal Reserve rate hike in December. Currently, the market prices in approximately an 87% probability of a 25-basis-point rate hike in December and about a 13% probability of a 50-basis-point hike. Meanwhile, the U.S. Dollar Index climbed to around 103. A stronger dollar and rising U.S. Treasury yields have enhanced the relative appeal of holding dollar- and bond-denominated assets, putting pressure on risk assets such as Bitcoin.
In terms of fund flows, U.S. spot Bitcoin ETFs continued to face redemptions. According to CoinGlass data, U.S. spot Bitcoin ETFs logged net outflows of $299.8 million on November 11, up from $95 million in the prior trading session. Among them, BlackRock's IBIT recorded net outflows of $269.7 million. Since November 5, spot Bitcoin ETFs have seen cumulative net outflows of over $1.4 billion, indicating that investor demand for allocating to Bitcoin via ETFs remains weak recently.
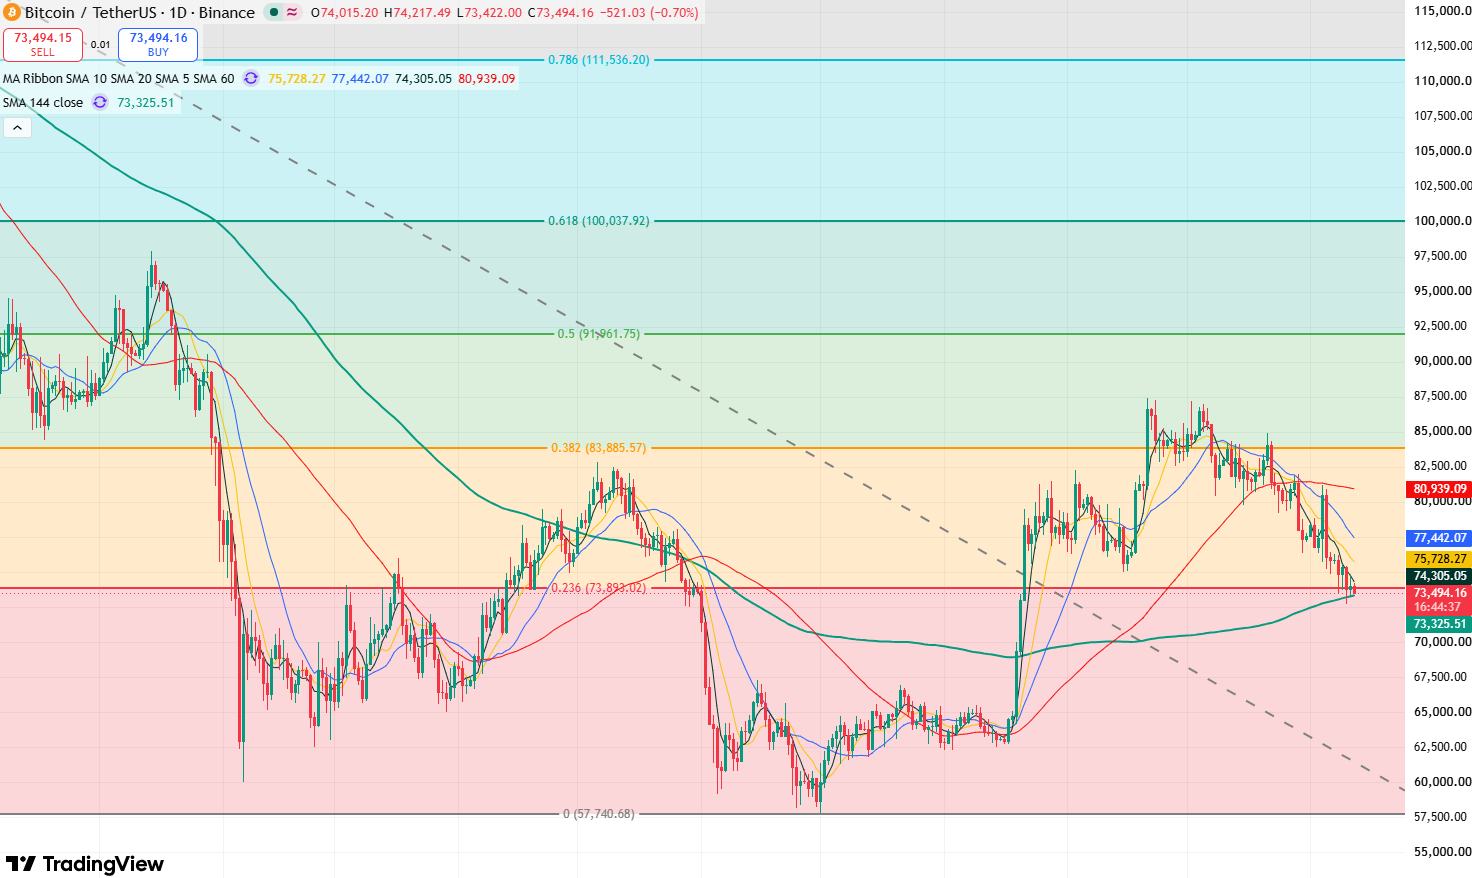
Bitcoin daily price chart, Source: TradingView
From Bitcoin's daily chart, Bitcoin has continued to decline recently, with candlestick highs and lows steadily moving lower. Following the breakdown below the September 15 low of $74,967, Bitcoin's recent candlestick structure has weakened noticeably, with bearish momentum clearly dominating the market.
In terms of technical indicators, the Relative Strength Index (RSI) sits near 33.9 and has not yet entered oversold territory, indicating that the likelihood of further near-term downside remains significant. Meanwhile, the MACD continues to linger in negative territory, showing that downward momentum has not yet fully dissipated.
Currently, Bitcoin has retreated to near its 144-day moving average ($73,000), which also coincides with the 0.236 Fibonacci retracement level, potentially creating a confluence of support. If Bitcoin can hold firmly above $73,000 in the near term, it is poised for a short-term technical corrective rebound. The initial target of the rebound would be to test resistance at $75,000; a breakout above this level would see it further test resistance at $77,000.
Conversely, if Bitcoin breaks below $73,000, it will open up room for a deeper decline, with the primary downside target to watch being the $70,000 mark. If this level is lost, Bitcoin will slide further toward $67,000.
Nothing in this material constitutes investment advice, personal recommendation, investment research, an offer, or a solicitation to buy or sell any financial instrument. The content has been prepared without consideration of your individual investment objectives, financial situation, or needs, and should not be treated as such.
Past performance is not a reliable indicator of future performance and/or results. Forward-looking scenarios or forecasts are not a guarantee of future performance. Actual results may differ materially from those anticipated.
Mitrade makes no representation or warranty as to the accuracy or completeness of the information provided and accepts no liability for any loss arising from reliance on such information.
Recommended Articles


