



How to Read a Gold Price Chart: Candles & Trends
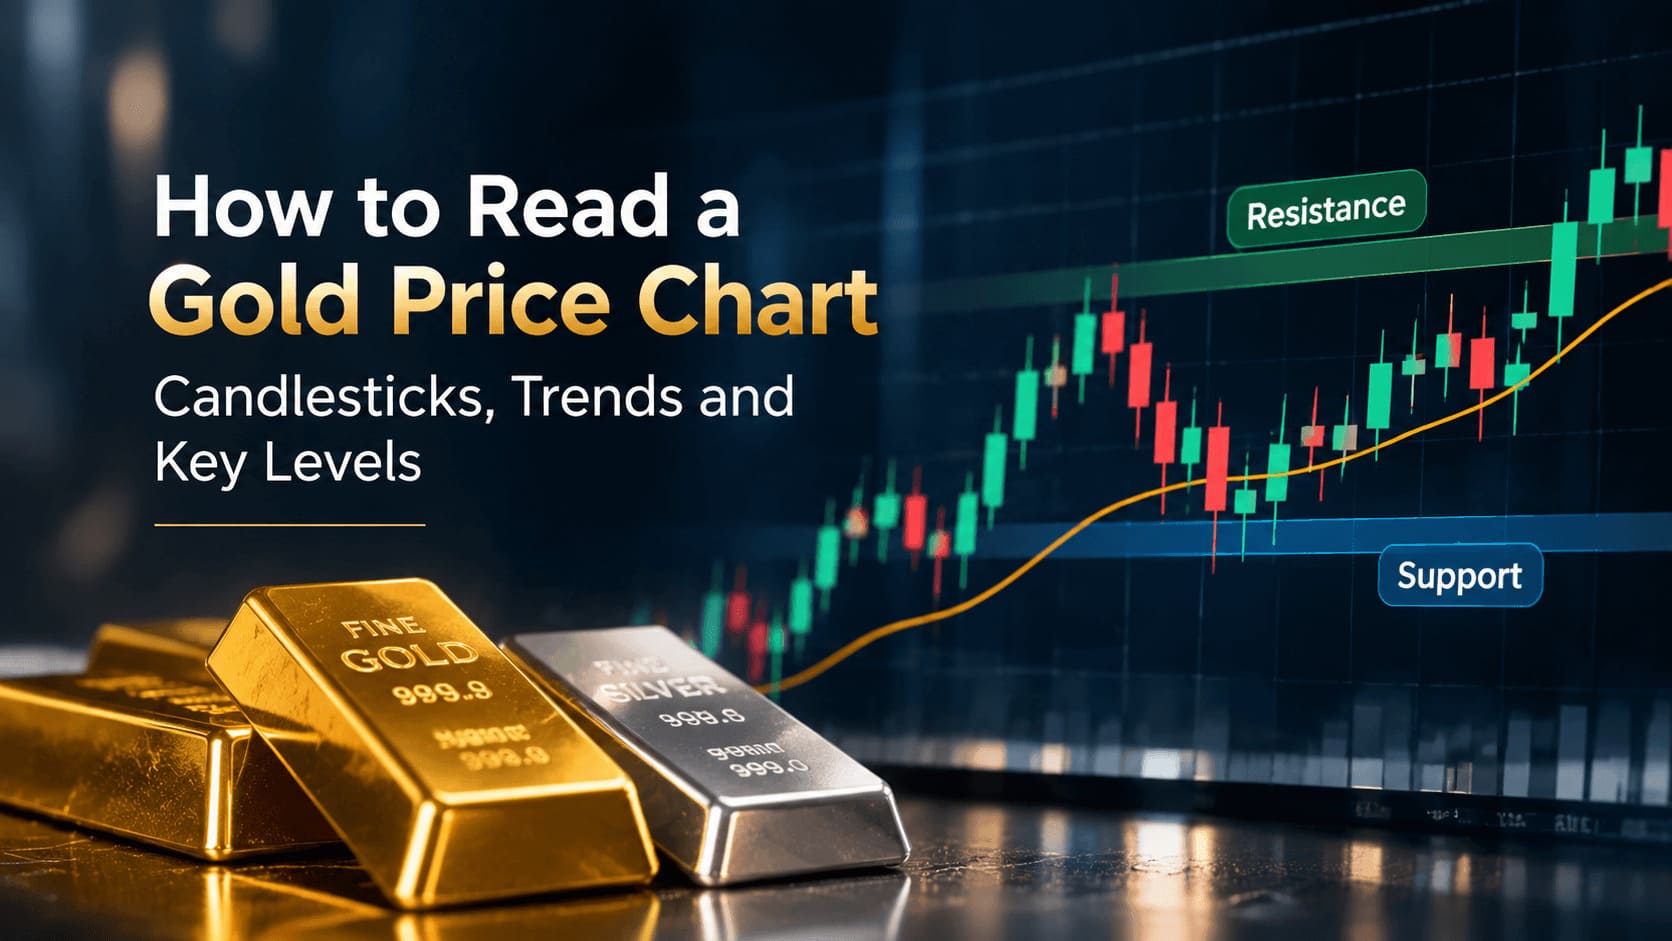
A beginner’s guide to XAU/USD, timeframes, support and resistance
A gold price chart may show moving lines, green and red candles, and several timeframes. But what do these elements actually mean? This guide explains how to interpret historical price information, identify common chart features and understand their limits—without treating past patterns as reliable forecasts or trading signals.
Key takeaways
Check the instrument (for example, XAU/USD), quoted currency, timeframe and data source before analysing a chart.
Each candlestick summarises the open, high, low and close (OHLC) for one selected interval.
Trends and support or resistance zones describe historical movement; they do not guarantee future prices.
A gold chart quoted in euros may look different from one quoted in US dollars because exchange rates change.
What does a gold price chart (XAU/USD) show?
The horizontal axis generally represents time and the vertical axis represents price. XAU/USD commonly quotes gold in US dollars per troy ounce. A euro-denominated chart can follow a different path when the EUR/USD exchange rate moves. It is also important to distinguish a spot-price reference from futures prices or CFD quotes: they are not necessarily identical at every moment.
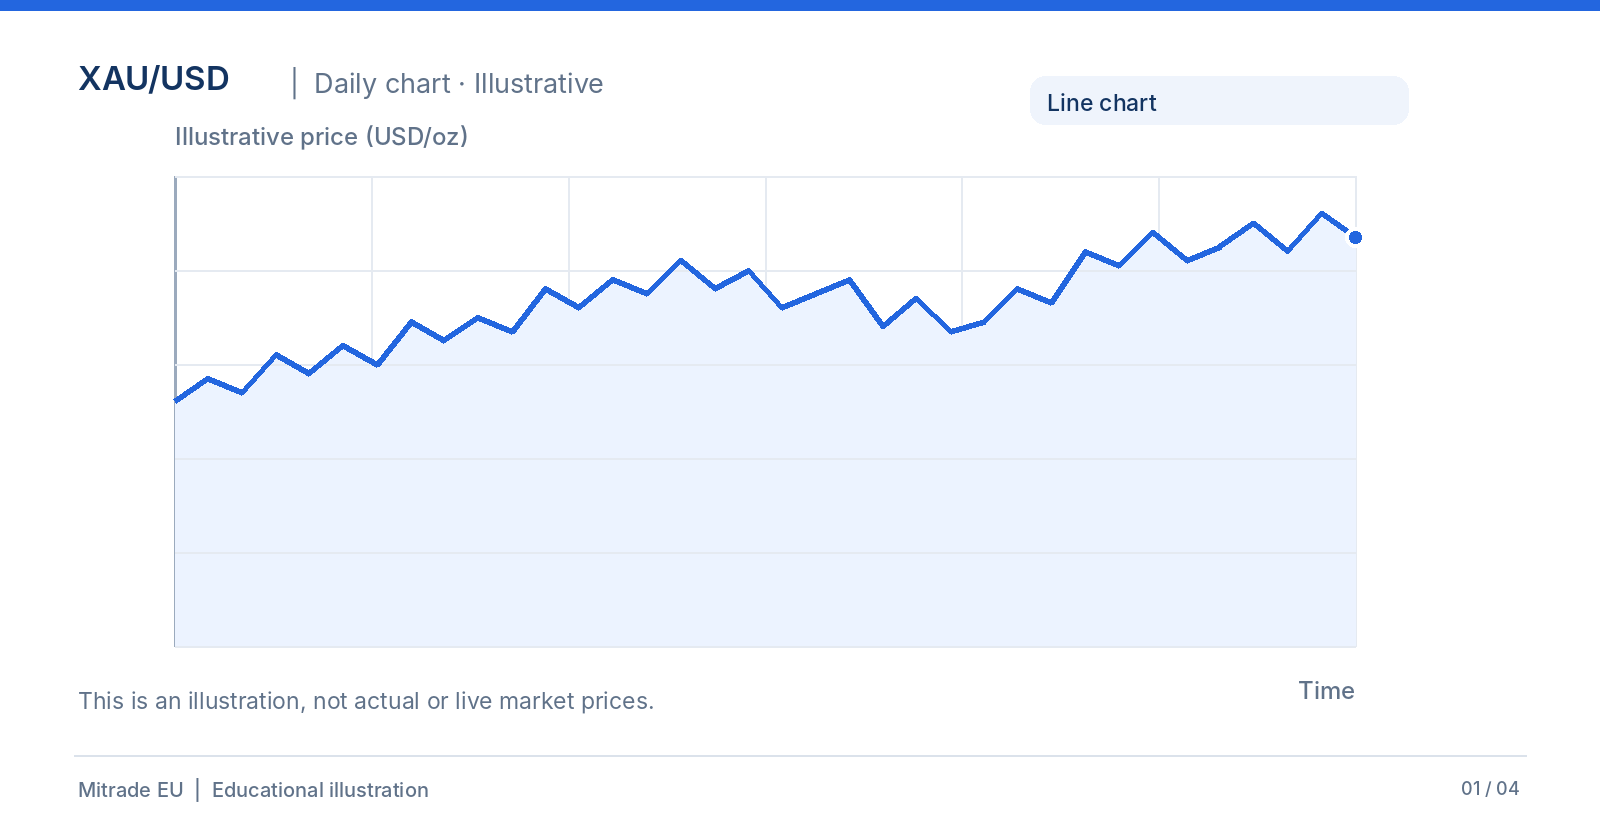
Example XAU/USD chart with time and price axes; not actual market data.
Line, bar and candlestick charts: What is the difference?
A line chart often connects the closing prices of consecutive intervals and is useful for a quick overview. A bar chart shows the open, high, low and close. A candlestick chart displays the same four figures with a thicker body that makes the opening-to-closing range easier to see. CME Group also describes these common chart types in its educational materials.
How do you read a gold candlestick? Open, high, low and close
The candle body runs between the opening and closing prices. The upper wick, when present, shows the highest price observed during the period; the lower wick shows the lowest. Green often indicates a close above the open, while red often indicates a close below it. Charting platforms can use different colour settings.
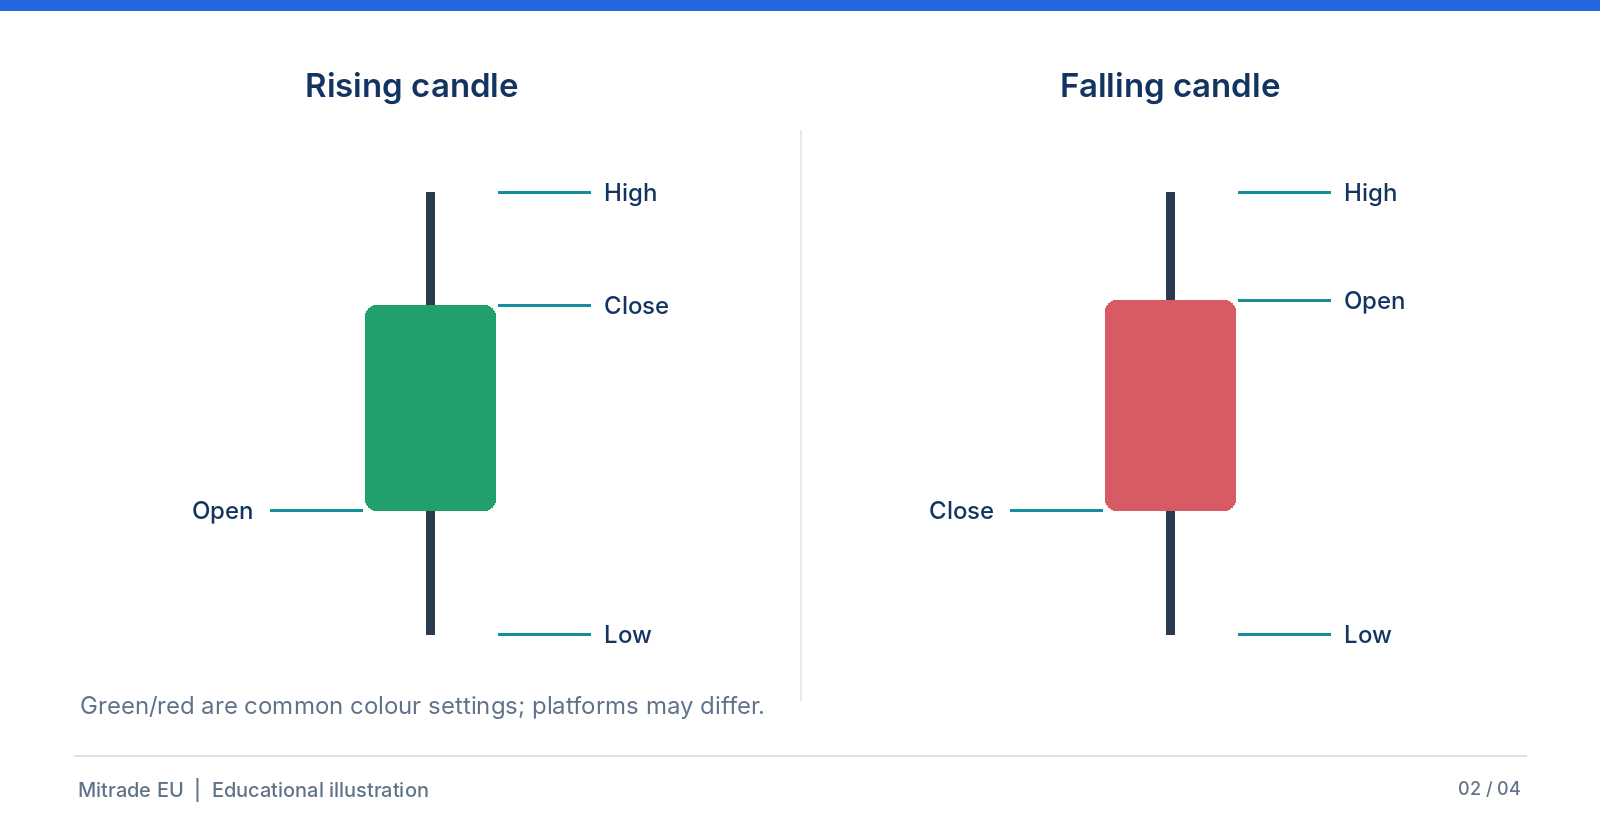
The structure of rising and falling candles, showing open, high, low and close.
Consider a purely hypothetical daily candle: open USD 3,000, high USD 3,035, low USD 2,985 and close USD 3,020 per troy ounce. The closing price is USD 20 above the opening price, while the full high-to-low range is USD 50. These numbers are for teaching purposes only—not current or historical gold prices.
A long body or wick can reveal substantial movement within that interval, but a single candlestick cannot reliably tell us what the next candle will do.
How do 1-hour, daily and weekly charts differ?
The timeframe determines how much price action each candle covers. The same series can look noisy on an hourly chart and relatively smooth on a weekly chart. No timeframe is universally best; it depends on the question you are investigating.
Timeframe | One candle represents | Typical perspective |
1 hour (1H) | One hour of price data | Short-term fluctuations |
1 day (1D) | One daily interval | Several weeks or months |
1 week (1W) | One weekly interval | Longer-term patterns |
How can you identify a trend on a gold chart?
Chart readers often describe an uptrend as a succession of higher highs and higher lows. Lower highs and lower lows may describe a downtrend. Repeated movement inside a relatively narrow range is sometimes called sideways trading or consolidation. These observations depend on the period being examined.
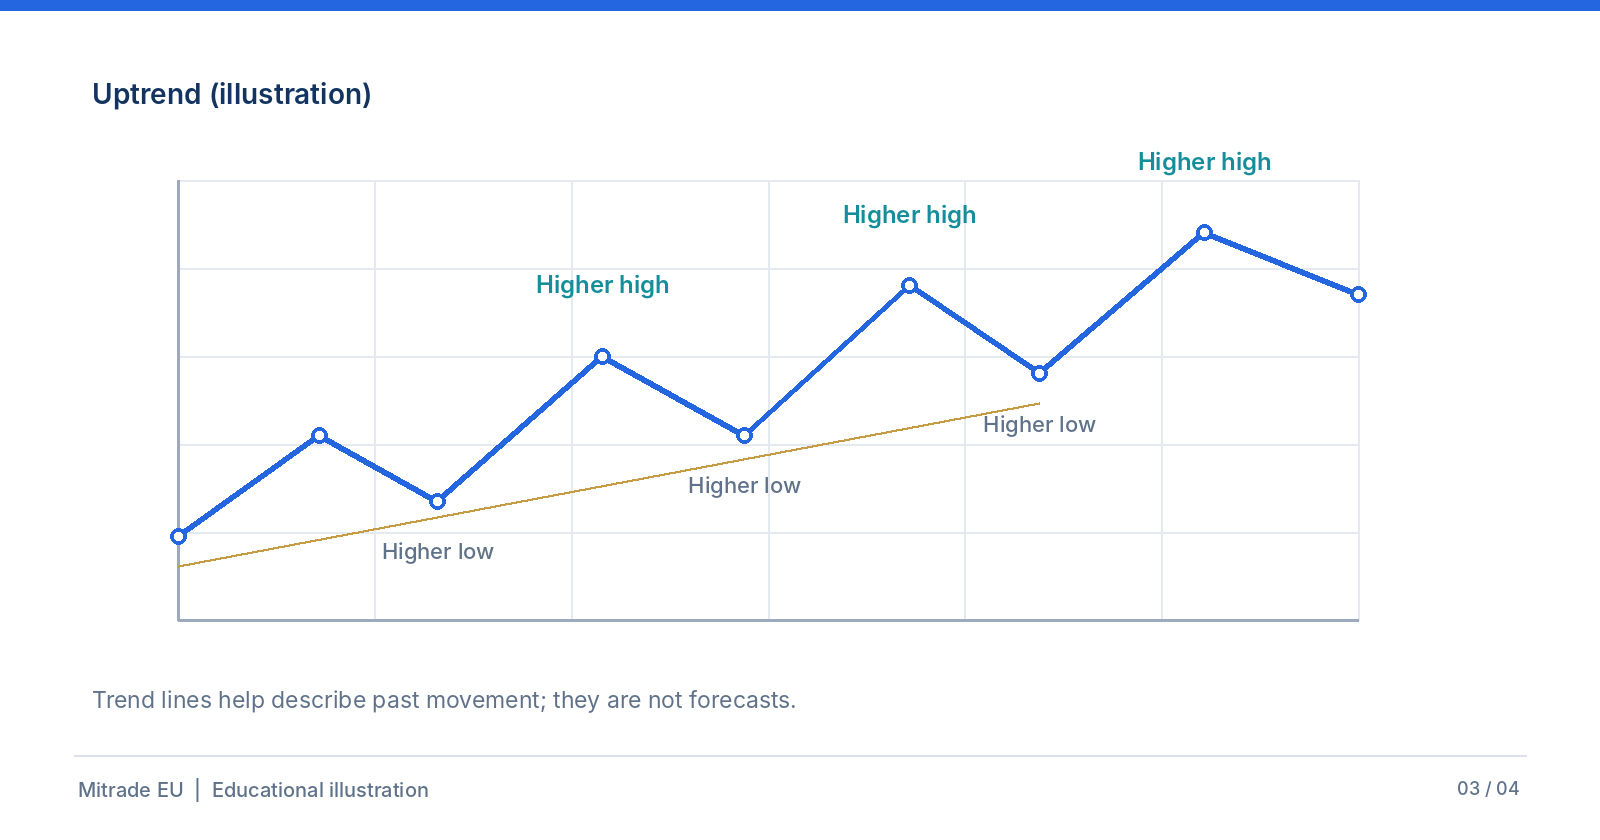
Illustrative uptrend with a sequence of higher highs and higher lows.
A trend line joins selected historical points. Two analysts may draw different lines depending on which highs or lows they choose. A trend line describes past behaviour; it is not a reliable prediction by itself.
What do support and resistance mean for gold prices?
Support is a price area where buying interest has appeared repeatedly in the past. Resistance is an area where selling interest has previously appeared. It is often more useful to think in zones than in exact prices: the market can cross these levels, and different datasets or timeframes may produce different boundaries.
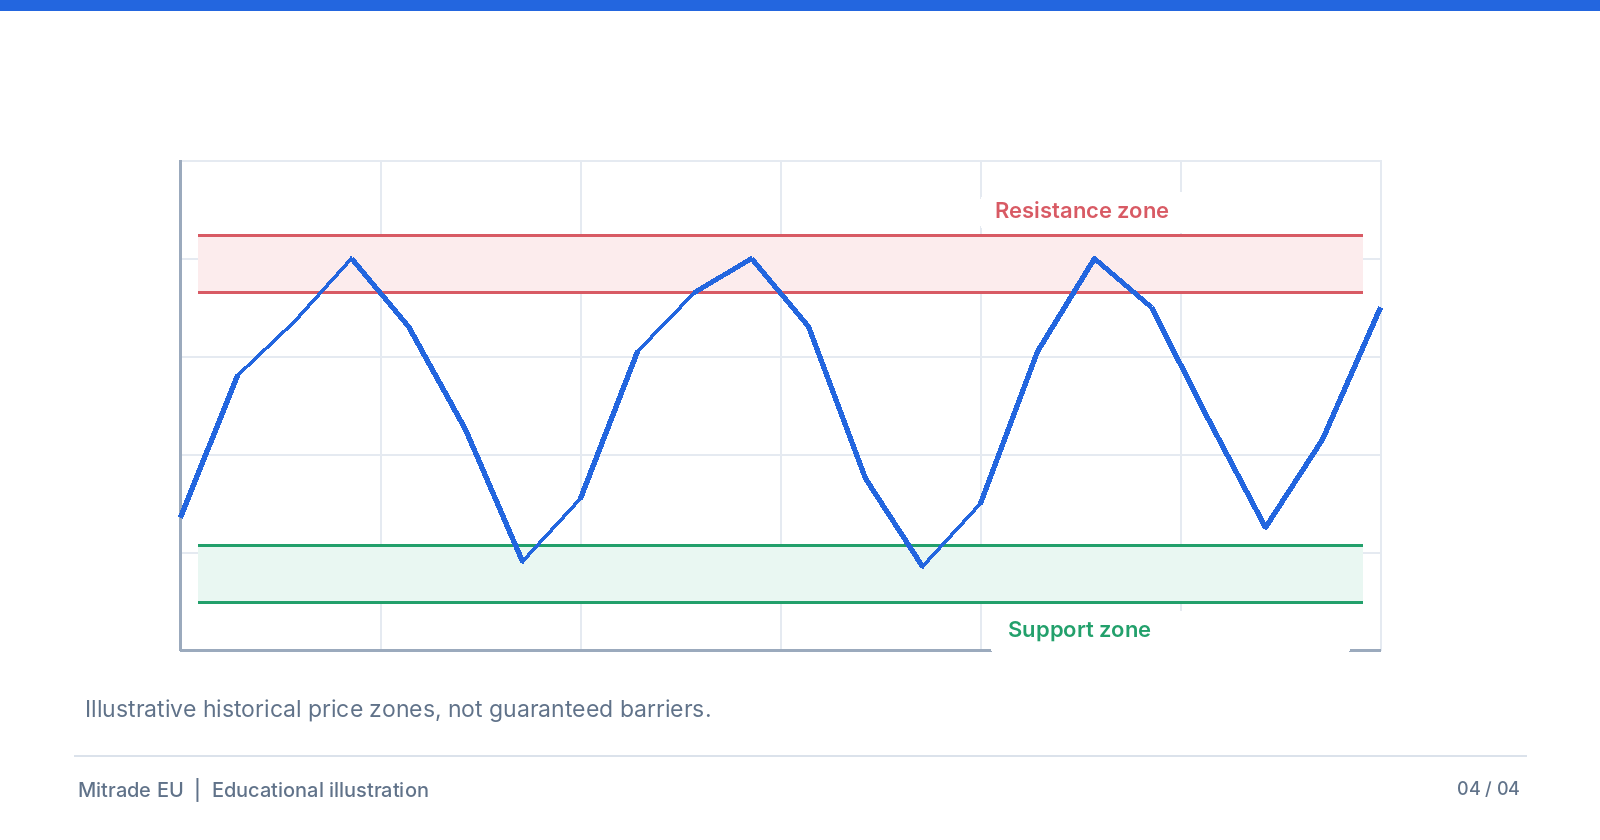
Illustrative historical support and resistance zones, not guaranteed price barriers.
A simple four-step checklist for reading a gold chart
Identify the instrument and source: XAU/USD, XAU/EUR, spot, futures or CFD?
Check the timeframe and compare shorter and longer views where relevant.
Describe candles, highs, lows and possible price zones without assuming a future outcome.
Consider fundamental developments and risks before drawing broader conclusions.
Why is technical analysis alone not enough for gold?
Gold prices can be affected by the US dollar, nominal and real interest-rate expectations, central-bank activity, physical demand and geopolitical events. Their influence changes over time. Technical analysis describes observed market movement; fundamental analysis considers possible underlying drivers. Neither approach guarantees future performance.
Further reading
Gold CFDs are derivatives linked to the price of gold; they do not give ownership of physical bullion. Mitrade EU has a separate educational guide describing how gold CFDs work, including their costs and risks.
What does XAU/USD mean?
XAU identifies gold and USD identifies the US dollar. XAU/USD expresses a gold price in US dollars per troy ounce. An XAU/USD CFD is a derivative, not ownership of physical gold.
Which chart timeframe should beginners use?
There is no single best timeframe. Daily or weekly charts may make broader price patterns easier to observe, while hourly charts show more short-term variation.
Does a green candle mean you should buy?
No. Under the common colour setting, it only means the close was above the open for that period. It does not reliably predict the next movement.
Can a chart predict tomorrow’s gold price?
No. Charts display historical movements. Patterns and price zones can support analysis, but they cannot guarantee the next price or direction.
Disclaimer: The content provided is for informational purposes only and does not constitute investment advice, a personal recommendation, or an invitation or inducement to buy or sell financial instruments. It has been prepared without consideration of your personal investment objectives or financial situation. No representation or warranty is made regarding the accuracy or completeness of the information. References to past performance or future projections are not reliable indicators of future performance.


