



US Dollar Index Price Forecast: Rally likely extend towards 104.00
- The US Dollar trades higher as traders take Fed’s 50 bps rate hike possibility into consideration.
- Investors await the US PPI data for October scheduled for Friday.
- Ongoing bullish trend backs further upside towards 104.00.
The US Dollar (USD) outperforms its major currency peers, except the Japanese Yen (JPY), on Thursday, amid fears that the Federal Reserve (Fed) could turn aggressive on its current monetary tightening cycle to contain elevated inflationary pressures.
US Dollar Price Today
The table below shows the percentage change of US Dollar (USD) against listed major currencies today. US Dollar was the strongest against the Australian Dollar.
| USD | EUR | GBP | JPY | CAD | AUD | NZD | CHF | |
|---|---|---|---|---|---|---|---|---|
| USD | 0.12% | 0.14% | -0.02% | 0.05% | 0.25% | 0.19% | -0.01% | |
| EUR | -0.12% | 0.03% | -0.14% | -0.07% | 0.13% | 0.08% | -0.13% | |
| GBP | -0.14% | -0.03% | -0.15% | -0.10% | 0.10% | 0.06% | -0.16% | |
| JPY | 0.02% | 0.14% | 0.15% | 0.05% | 0.25% | 0.20% | -0.01% | |
| CAD | -0.05% | 0.07% | 0.10% | -0.05% | 0.20% | 0.15% | -0.06% | |
| AUD | -0.25% | -0.13% | -0.10% | -0.25% | -0.20% | -0.03% | -0.27% | |
| NZD | -0.19% | -0.08% | -0.06% | -0.20% | -0.15% | 0.03% | -0.19% | |
| CHF | 0.01% | 0.13% | 0.16% | 0.01% | 0.06% | 0.27% | 0.19% |
The heat map shows percentage changes of major currencies against each other. The base currency is picked from the left column, while the quote currency is picked from the top row. For example, if you pick the US Dollar from the left column and move along the horizontal line to the Japanese Yen, the percentage change displayed in the box will represent USD (base)/JPY (quote).
During the day, the US Dollar Index (DXY), which gauges the Greenback’s value against six major currencies, posts a fresh 18-month high at 103.08.
However, the likelihood of a bigger Fed interest rate hike in the December meeting is very weak, but has done significant to lend strength to the United States (US) currency.
Fed hike debate intensifies as Waller comments revive 50bp risk
Analysts at MUFG/BTMU note that the latest market rethink has been driven less by the inflation data itself and more by Fed Governor Christopher Waller’s remarks ahead of the release. They highlight that “on this occasion the market rethink is to consider the prospect of a 50bp hike,” a possibility “only now being considered because of Waller’s comments prior to the CPI report rather than the CPI report itself.” Waller’s suggestion that “a stronger CPI print may warrant a 50bp hike” has, in their view, “sparked a debate over whether Waller had knowledge of the CPI print.”
According to MUFG/BTMU, the repricing has filtered quickly into rates markets, with “the OIS market now partially pricing the risk of a 50bp hike on 9th December.” They point out that Waller “makes the point that the sticky inflation and energy risks warrant the reversal of the 75bps of cuts and hence why wait two meetings to do that,” reinforcing the case for a faster policy adjustment.
Even so, MUFG/BTMU stress that “we remain sceptical of the need to hike by 50bps at this stage and suspect the majority will see the better risk-reward in going by 25bps.” They underline that there is “still another payrolls report (but no further CPI prints, although it’s the day after) before the FOMC meeting,” and caution that “a strong print plus a rebound in crude oil after the recent sharp drop would be one scenario of a possible more aggressive hike.”
Going forward, financial markets will pay attention to the US Producer Price Index (PPI) data for October, which will be released on Friday.
US Dollar Index Technical Analysis
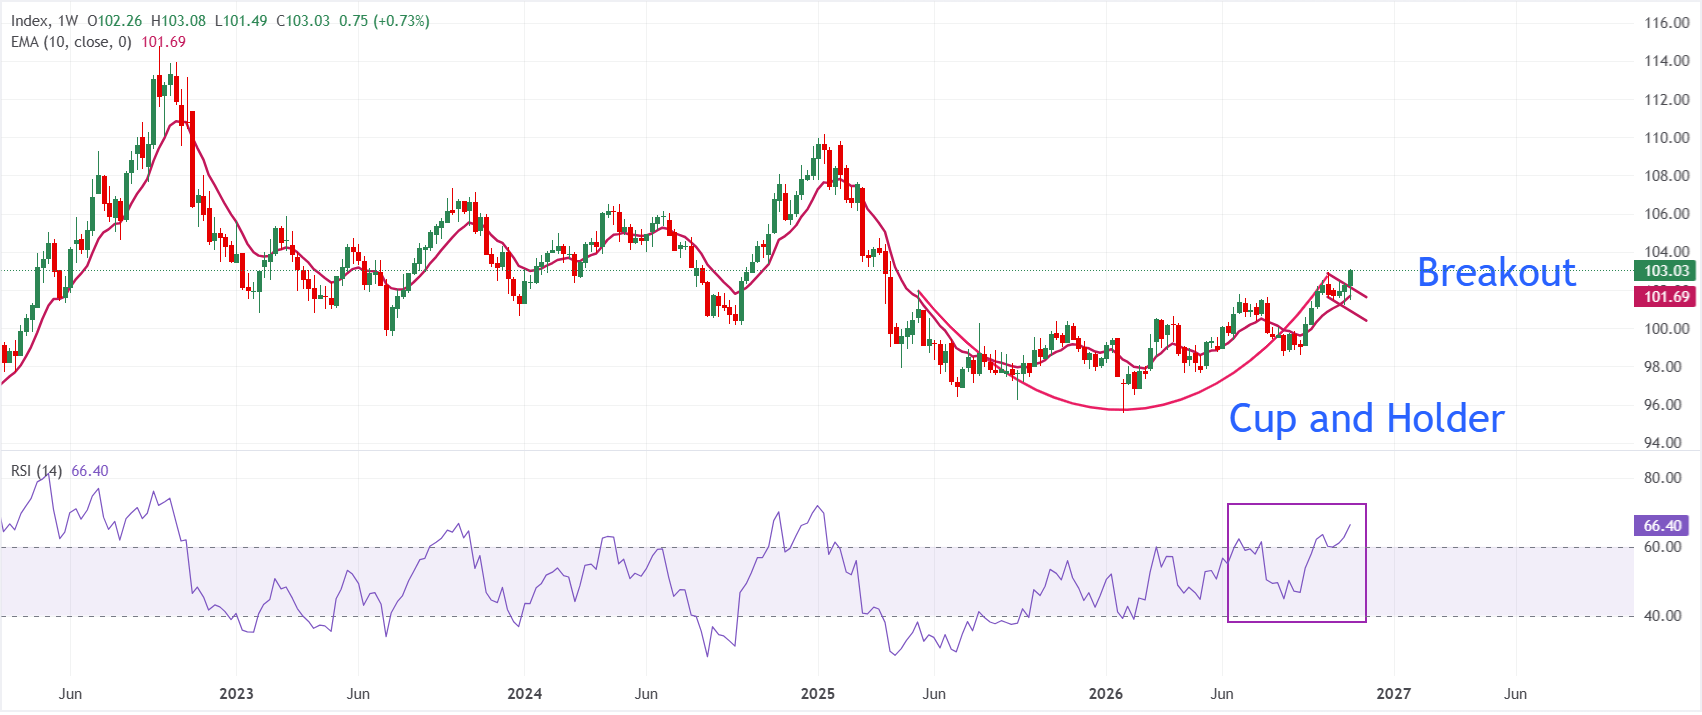
In the weekly chart, Dollar Index Spot trades at 103.02, extending a bullish breakout of the Cup and Holder formation. The pair now holds comfortably above the 10-week Exponential Moving Average (EMA) at 101.69 and the former channel top around 102.07, suggesting a firm supportive structure beneath price.
RSI (14) at 66.36 shows strong positive momentum and is approaching overbought territory, hinting that while the advance remains constructive, upside progress could slow if buying pressure becomes stretched.
On the downside, initial support is seen at the former channel top near 102.07, followed by the 10-week EMA at 101.69 and the prior consolidation area around 101.64. A deeper pullback would likely seek the lower boundary of the channel near 100.84, where buyers could attempt to reassert control and preserve the broader bullish bias. On the upside, the index could extend its advance towards the 7 April 2025 high at 103.54, followed by 104.00
(The technical analysis of this story was written with the help of an AI tool. Know more.)
Economic Indicator
Producer Price Index (MoM)
The Producer Price Index released by the Bureau of Labor statistics, Department of Labor measures the average changes in prices in primary markets of the US by producers of commodities in all states of processing. Changes in the PPI are widely followed as an indicator of commodity inflation. Generally speaking, a high reading is seen as positive (or bullish) for the USD, whereas a low reading is seen as negative (or bearish).
Read more.Next release: Fri Nov 13, 2026 13:30
Frequency: Monthly
Consensus: 0.4%
Previous: 1.3%
Source: US Bureau of Labor Statistics
Nothing in this material constitutes investment advice, personal recommendation, investment research, an offer, or a solicitation to buy or sell any financial instrument. The content has been prepared without consideration of your individual investment objectives, financial situation, or needs, and should not be treated as such.
Past performance is not a reliable indicator of future performance and/or results. Forward-looking scenarios or forecasts are not a guarantee of future performance. Actual results may differ materially from those anticipated.
Mitrade makes no representation or warranty as to the accuracy or completeness of the information provided and accepts no liability for any loss arising from reliance on such information.
Recommended Articles


