

Deere & Co Stock (DE) Moved Down by 7.54% on May 21: Key Drivers Unveiled
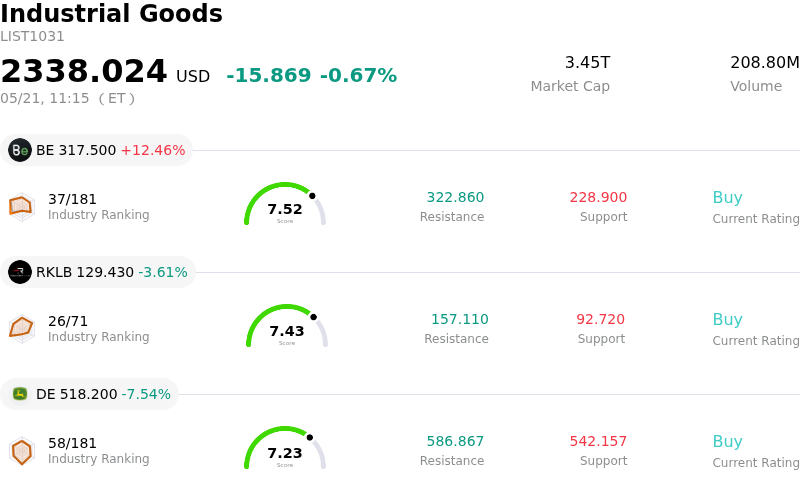
Deere & Co (DE) moved down by 7.54%. The Industrial Goods sector is down by 0.67%. The company underperformed the industry. Top 3 stocks by turnover in the sector: Bloom Energy Corp (BE) up 12.46%; Rocket Lab USA Inc (RKLB) down 3.61%; Deere & Co (DE) down 7.54%.
What is driving Deere & Co (DE)’s stock price down today?
Deere & Company (DE) experienced a downward price movement on May 21, 2026, primarily driven by investor reaction to its second-quarter fiscal 2026 earnings report, despite the company reporting higher-than-anticipated overall revenue and earnings per share. While worldwide net sales and revenues rose 5% to $13.369 billion, surpassing analyst estimates, and net income reached $1.773 billion ($6.55 per share) which also beat expectations, a deeper look into the segmental performance revealed a significant challenge in its core agricultural business.
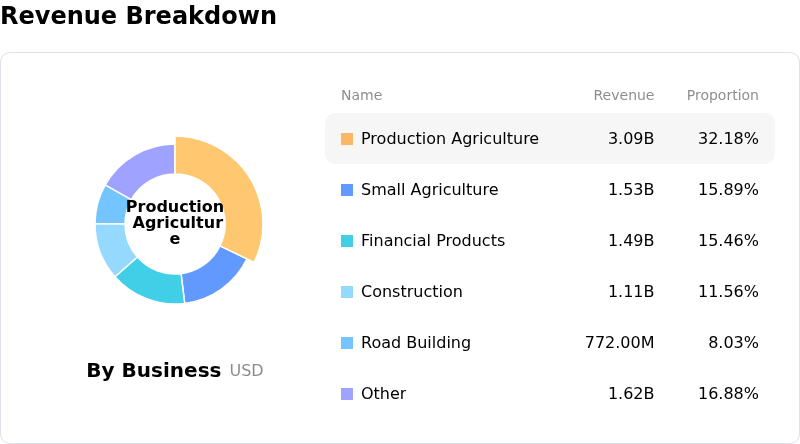
The Production & Precision Agriculture segment, a crucial component of Deere's operations, saw a substantial decline in net sales by 14% and a 39% drop in operating profit. This segment is grappling with an extended slowdown as farmers reduce large equipment purchases, influenced by elevated interest rates and a demanding agricultural market environment. Although the Small Agriculture & Turf and Construction & Forestry segments demonstrated robust growth, with sales increasing by 16% and 29% respectively, the weakness in large agriculture appears to have outweighed these positive developments in investors' eyes.
Furthermore, despite the company maintaining its full-year fiscal 2026 net income guidance in the range of $4.5 billion to $5.0 billion, and even raising its construction and forestry sales growth target, the persistent concerns regarding the outlook for large agricultural equipment demand, projected to be down 5% to 10%, likely fueled investor apprehension. Market sentiment before the earnings release had already highlighted a focus on the company's ability to offset weakness in the farm economy, and concerns about valuation potentially being stretched added to the negative reaction. Investors likely focused on the underlying weakness in a key market segment and its future implications rather than the overall financial beats.
Technical Analysis of Deere & Co (DE)
Technically, Deere & Co (DE) shows a MACD (12,26,9) value of [-2.55], indicating a sell signal. The RSI at 42.65 suggests neutral condition and the Williams %R at -76.67 suggests oversold condition. Please monitor closely.
Fundamental Analysis of Deere & Co (DE)
Deere & Co (DE) is in the Industrial Goods industry. Its latest annual revenue is $45.67B, ranking 2 in the industry. The net profit is $5.03B, ranking 2 in the industry. Company Profile
Over the past month, multiple analysts have rated the company as Buy, with an average price target of $653.65, a high of $793.00, and a low of $471.00.
More details about Deere & Co (DE)
Company Specific Risks:
- Deere & Company forecasts a significant decline in U.S. & Canada Large Ag industry demand of 15-20% for fiscal 2026, directly impacting its core Production & Precision Agriculture segment.
- Net income attributable to Deere & Company for Q2 2026 decreased to $1.773 billion, compared to $1.804 billion in the prior year quarter, signaling a year-over-year contraction in profitability despite overall revenue growth.
- Market sentiment is negatively impacted by the weak large-agriculture outlook and concerns over flat farm income, leading to stock price pressure despite an overall earnings beat.
- Ongoing exposure to challenges within global agricultural markets, including sensitivity to tariffs, rising input costs, and the risk that heavy investments in new products may not achieve expected adoption or pricing power.
Nothing in this material constitutes investment advice, personal recommendation, investment research, an offer, or a solicitation to buy or sell any financial instrument. The content has been prepared without consideration of your individual investment objectives, financial situation, or needs, and should not be treated as such.
Past performance is not a reliable indicator of future performance and/or results. Forward-looking scenarios or forecasts are not a guarantee of future performance. Actual results may differ materially from those anticipated.
Mitrade makes no representation or warranty as to the accuracy or completeness of the information provided and accepts no liability for any loss arising from reliance on such information.
Recommended Articles


