

Silver Price Forecast: Bears retain near-term control as RSI slips below 50
- Silver hovers near two-week lows as markets track conflicting headlines surrounding US-Iran negotiations.
- A stronger US Dollar and elevated Treasury yields continue to pressure XAG/USD amid rising Fed rate hike expectations.
- Technically, Silver maintains a bearish near-term bias while holding below the 20-period Bollinger SMA near $77.46.
Silver (XAG/USD) trades in a narrow range on Thursday as traders continue to monitor developments surrounding the US-Iran conflict. At the time of writing, XAG/USD is trading around $75.20, hovering near two-week lows.
The precious metal came under brief pressure earlier in the day after Reuters reported that Iran’s Supreme Leader had ordered that near-weapons-grade uranium must remain inside the country, dampening hopes for progress in negotiations. However, Silver later trimmed part of its earlier losses after an Iranian official denied the report in comments to Al Jazeera.
Still, XAG/USD’s upside remains capped by a stronger US Dollar (USD) and elevated US Treasury yields amid rising expectations that the Federal Reserve (Fed) may need to raise interest rates to contain inflationary pressures stemming from higher Oil prices.
Looking ahead, price action remains driven by geopolitical headlines as markets await further clarity on US-Iran negotiations after US President Donald Trump said on Wednesday that talks with Iran were in the “final stages,” though he warned that military action could resume if no deal is reached. Trump also said Washington was willing to wait a few more days for the “right answer” from Tehran.
Technical Analysis:
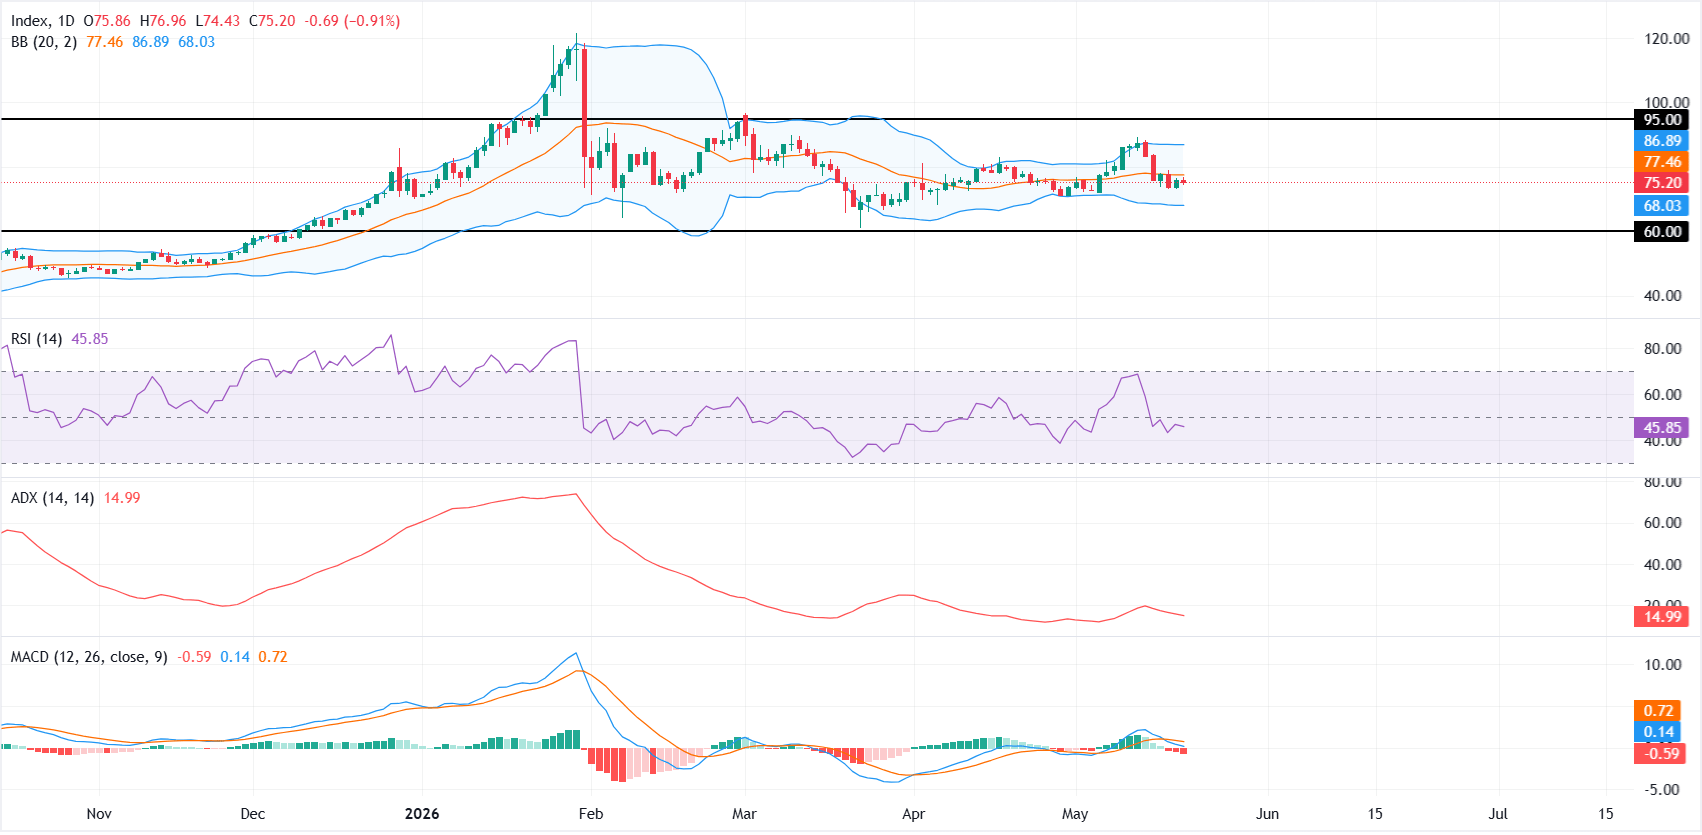
On the daily chart, XAG/USD maintains a bearish near-term bias as it holds below the 20-period Bollinger Simple Moving Average (SMA) clustered near $77.46. The price also sits well under the upper Bollinger band around $86.89, keeping the broader recovery phase capped, while initial volatility support emerges at the lower band near $68.03.
Momentum readings reinforce the soft downside tone, with the Relative Strength Index (RSI) slipping below the 50 line at 45.9, the Moving Average Convergence Divergence (MACD) indicator extending deeper into negative territory, and a subdued Average Directional Index (ADX) near 15 hinting at a weak but bearish trend.
On the topside, immediate resistance is located at the 20-period Bollinger SMA around $77.46; a daily close above this barrier would be needed to ease current selling pressure, before the focus could shift toward the upper band resistance near $86.89 and then the more distant horizontal ceiling at $95.00.
On the downside, initial support is found at the lower Bollinger band around $68.03, with a break there exposing the more substantial horizontal floor at $60.00, where longer-term buyers could look to re-enter the market.
(The technical analysis of this story was written with the help of an AI tool.)
Silver FAQs
Silver is a precious metal highly traded among investors. It has been historically used as a store of value and a medium of exchange. Although less popular than Gold, traders may turn to Silver to diversify their investment portfolio, for its intrinsic value or as a potential hedge during high-inflation periods. Investors can buy physical Silver, in coins or in bars, or trade it through vehicles such as Exchange Traded Funds, which track its price on international markets.
Silver prices can move due to a wide range of factors. Geopolitical instability or fears of a deep recession can make Silver price escalate due to its safe-haven status, although to a lesser extent than Gold's. As a yieldless asset, Silver tends to rise with lower interest rates. Its moves also depend on how the US Dollar (USD) behaves as the asset is priced in dollars (XAG/USD). A strong Dollar tends to keep the price of Silver at bay, whereas a weaker Dollar is likely to propel prices up. Other factors such as investment demand, mining supply – Silver is much more abundant than Gold – and recycling rates can also affect prices.
Silver is widely used in industry, particularly in sectors such as electronics or solar energy, as it has one of the highest electric conductivity of all metals – more than Copper and Gold. A surge in demand can increase prices, while a decline tends to lower them. Dynamics in the US, Chinese and Indian economies can also contribute to price swings: for the US and particularly China, their big industrial sectors use Silver in various processes; in India, consumers’ demand for the precious metal for jewellery also plays a key role in setting prices.
Silver prices tend to follow Gold's moves. When Gold prices rise, Silver typically follows suit, as their status as safe-haven assets is similar. The Gold/Silver ratio, which shows the number of ounces of Silver needed to equal the value of one ounce of Gold, may help to determine the relative valuation between both metals. Some investors may consider a high ratio as an indicator that Silver is undervalued, or Gold is overvalued. On the contrary, a low ratio might suggest that Gold is undervalued relative to Silver.
Nothing in this material constitutes investment advice, personal recommendation, investment research, an offer, or a solicitation to buy or sell any financial instrument. The content has been prepared without consideration of your individual investment objectives, financial situation, or needs, and should not be treated as such.
Past performance is not a reliable indicator of future performance and/or results. Forward-looking scenarios or forecasts are not a guarantee of future performance. Actual results may differ materially from those anticipated.
Mitrade makes no representation or warranty as to the accuracy or completeness of the information provided and accepts no liability for any loss arising from reliance on such information.
Recommended Articles


