

Solana (SOLUSD) Is up 1.01% on Jun 27: What Are the Risk Factors?
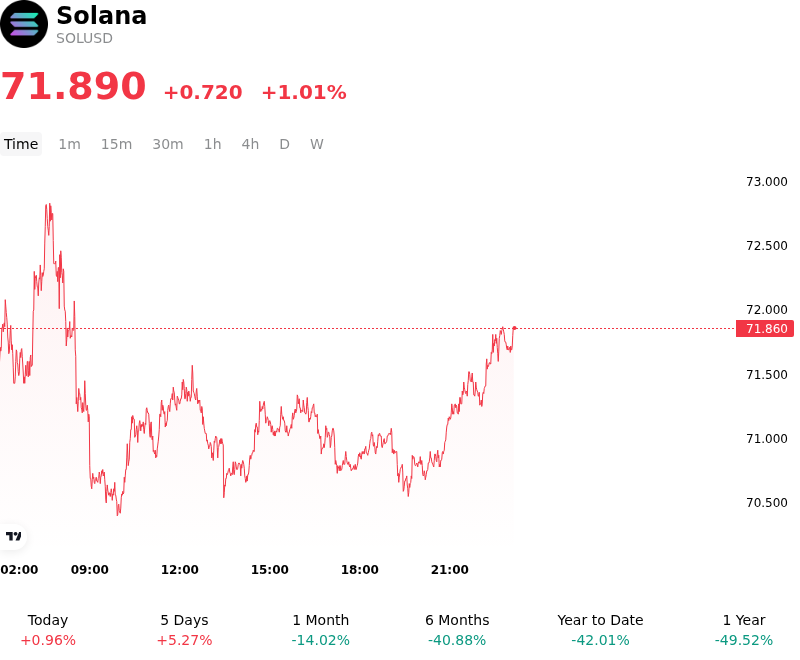
Solana (SOLUSD) is up 1.01% at Jun 27 11:10(ET), now at $71.89, with a 7-day up of 1.24%.
What is driving Solana (SOLUSD)’s stock price up today?
Solana (SOLUSD) demonstrated notable upward momentum and intraday resilience, driven by a convergence of positive institutional developments, global exchange-traded product expansion, and record-setting network utilization. Capital flowed into the asset as structural improvements in the Solana investment ecosystem altered long-term demand expectations and triggered institutional buying interest.
A primary catalyst for the positive sentiment was the intense competitive positioning in the spot Solana investment vehicle landscape. Following the launch of the first spot Solana product cohort, major asset managers have aggressively optimized their offerings to capture market share. For instance, Grayscale filed an amendment to its Solana Staking ETF trust, significantly reducing its annual sponsor fee to 0.19% and cutting its staking fee to 7% of gross staking rewards. Concurrently, Morgan Stanley advanced its proposed spot Solana Trust by filing an updated registration that detailed an exceptionally low 0.14% sponsor fee along with plans to pass through 95% of staking yields to shareholders. These structural fee reductions and the integration of staking yields drastically lower the cost of access for institutional and wealth-managed portfolios, enhancing the net yield profile and attracting immediate dip-buying.
This institutional momentum was further bolstered by international regulatory progress and product launches. Regulated exposure to the asset expanded globally as a new futures-based Solana ETF commenced trading on the Kazakhstan Stock Exchange. This development underscores the continuing institutionalization of Solana on international capital rails, helping to establish a stronger regulatory floor and neutralizing long-held concerns regarding its asset classification.
On-chain performance and utility metrics also provided fundamental justification for the capital inflows. Solana set a new network record by processing over half a billion dollars in daily transaction volume for tokenized equities, highlighting its dominant role in the migration of real-world assets to public ledgers. This milestone coincided with broader quarterly data showing transaction volumes on the network reaching historic highs, with stablecoin capitalization and total value locked in native tokens achieving record numbers. This structural network traffic signals to allocators that the ecosystem is transitioning from speculative retail activity to high-volume commercial utility.
While macroeconomic uncertainty and recent deleveraging in the broader digital asset market—particularly stemming from volatility in Bitcoin and spot ETF outflows elsewhere—have created brief headwinds, the combination of competitive fee compression, global fund expansion, and tangible real-world asset volume allowed Solana to decouple and attract buying interest. Investors continue to monitor systemic liquidity conditions, leverage risks in derivatives positioning, and the final regulatory sign-offs for pending spot structures as key variables for sustained price appreciation.
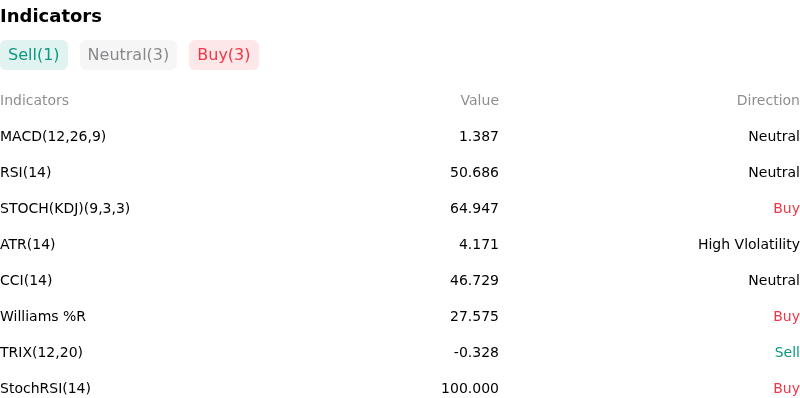
Technical Analysis of Solana (SOLUSD)
Technically, Solana (SOLUSD) shows a MACD (12,26,9) value of 1.387, indicating a neutral signal. The RSI at 50.686 suggests neutral condition and the Williams %R at 27.575 suggests buy condition. Please monitor closely.
More details about Solana (SOLUSD)
Recent Events and Risks:
- Market-Wide Liquidation Contagion: A severe market-wide downturn on June 25, 2026—partially triggered by Bitcoin dropping below $58,000—led to over $600 million in industry-wide liquidations, cascading systemic deleveraging pressure onto SOLUSD and triggering a sharp rise in long liquidation imbalances.
- Bearish Double-Top Breakdown: SOLUSD completed a bearish double-top pattern after failing to breach the key $75 resistance zone, with 29 of 30 major technical indicators flashing sell signals. On June 24, 2026, the price broke below critical neckline support at $68, activating dense clusters of long liquidation stop orders and exposing the asset to a downside target of $60.80.
- Elevated Whale Exchange Inflows: On-chain tracking data from the last 72 hours reveals a sudden influx of approximately 600,000 SOL tokens deposited into centralized exchanges. This heavy concentration of whale-led deposits indicates immediate intent to distribute or hedge, creating severe overhead selling pressure and capping immediate recovery attempts.
- Slowing Network Activity and FTX Supply Overhang: Solana's decentralized exchange (DEX) volumes and on-chain fee generation have significantly cooled from earlier peaks, casting doubt on the network's token-accrued monetization given near-zero transaction fees. This drop in organic demand is compounded by market concerns over upcoming July 2026 token unlocks and liquidations from the FTX bankruptcy estate.
Nothing in this material constitutes investment advice, personal recommendation, investment research, an offer, or a solicitation to buy or sell any financial instrument. The content has been prepared without consideration of your individual investment objectives, financial situation, or needs, and should not be treated as such.
Past performance is not a reliable indicator of future performance and/or results. Forward-looking scenarios or forecasts are not a guarantee of future performance. Actual results may differ materially from those anticipated.
Mitrade makes no representation or warranty as to the accuracy or completeness of the information provided and accepts no liability for any loss arising from reliance on such information.
Recommended Articles


