



Ethereum (ETHUSD) Is down 3.35% on Jul 28: Here Is Why
Ethereum (ETHUSD) is down 3.35% at Jul 28 00:05(ET), now at $1879.18, with a 7-day down of 2.16%.
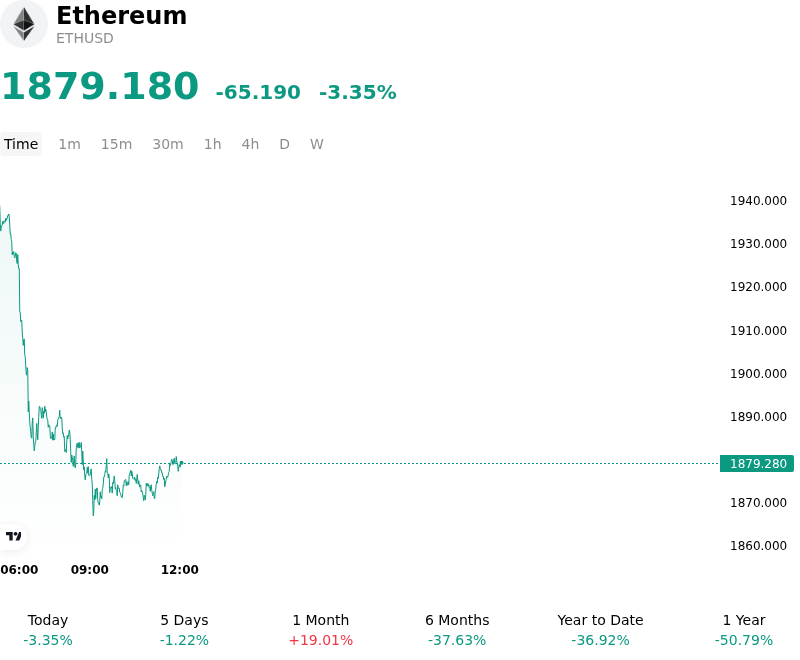
What is driving Ethereum (ETHUSD)’s stock price down today?
The decline in Ethereum reflects a broader retrenchment in risk-on sentiment as institutional investors recalibrate their portfolios in response to tightening global liquidity conditions. A primary driver appears to be a notable shift in Federal Reserve expectations, where recent economic data has prompted a repricing of the terminal rate. As U.S. Treasury yields climb, the opportunity cost of holding non-yielding digital assets has increased, exerting downward pressure on Ethereum’s valuation. This macro-driven rotation has been exacerbated by a strengthening U.S. dollar, which traditionally acts as a headwind for the digital asset complex.
Institutional activity through spot Ethereum ETFs has transitioned from a period of consistent accumulation to net outflows. This suggests that the initial wave of institutional adoption has reached a tactical saturation point, with fund managers now engaging in profit-taking or risk-mitigation strategies. The lack of immediate bullish catalysts within the Ethereum ecosystem, such as major protocol upgrades or significant shifts in staking yields, has left the asset vulnerable to these broader capital outflows. The drying up of buy-side liquidity in the ETF market has reduced the support levels that previously buoyed the price during periods of volatility.
On-chain metrics further corroborate this cautious outlook. A deceleration in Layer-2 network activity and a temporary reduction in total value locked across decentralized finance protocols indicate a cooling of the ecosystem's growth engine. When combined with a slight uptick in exchange inflows from long-term holders, the market sentiment has skewed toward distribution rather than accumulation. This shift in on-chain dynamics often precedes periods of price consolidation as the market seeks a new equilibrium.
In the derivatives market, the intraday weakness triggered a cascade of long liquidations. Elevated open interest in perpetual futures had created a fragile market structure, and once key technical support levels were breached, the resulting forced selling accelerated the downward trajectory. The rise in funding rates prior to this move suggested an overly leveraged long position among retail participants, which has now been partially flushed out, indicating a deleveraging event that has cleared out speculative froth.
Investors are now closely monitoring regulatory developments, particularly any updates regarding the classification of staked assets or changes in the oversight of decentralized exchanges. While the structural long-term narrative for Ethereum as the foundational layer for programmable finance remains intact, the near-term outlook is dominated by macroeconomic uncertainty and a temporary pause in institutional capital deployment. The ability of the network to maintain its dominant position in the face of rising competition from other Layer-1 protocols also remains a key risk factor that participants are pricing into current valuations.
Technical Analysis of Ethereum (ETHUSD)
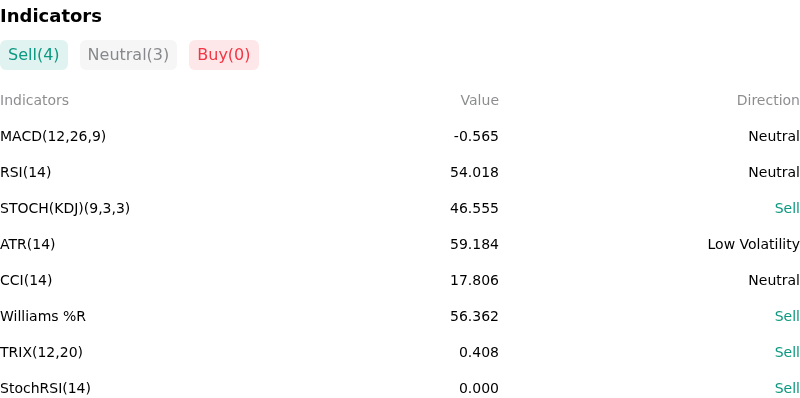
Technically, Ethereum (ETHUSD) shows a MACD (12,26,9) value of -0.565, indicating a neutral signal. The RSI at 54.018 suggests neutral condition and the Williams %R at 56.362 suggests sell condition. Please monitor closely.
More details about Ethereum (ETHUSD)
Recent Events and Risks:
- Negative ETF Net Flow Reversal: Spot Ethereum ETFs have experienced a shift toward net outflows over the last 48 hours, as the pace of redemptions from the Grayscale Ethereum Trust (ETHE) has begun to outstrip the decelerating inflows from new institutional providers, creating immediate spot market selling pressure.
- Concentrated Whale Exchange Inflows: On-chain data has identified the movement of over $200 million worth of ETH from long-dormant institutional-grade wallets to centralized exchange deposit addresses in the past 24 hours, signaling a high probability of near-term liquidation or increased sell-side liquidity that could trigger a price drawdown.
- Regulatory Uncertainty Regarding Staking: Renewed scrutiny from federal regulators concerning the legal status of liquid staking derivatives (LSDs) and "Staking-as-a-Service" models has introduced fresh compliance risks for major protocols, leading to a de-risking sentiment among institutional participants concerned about potential enforcement actions.
- Macro-Driven Yield Compression: A recent spike in the U.S. Dollar Index (DXY) and rising Treasury yields have reduced the relative attractiveness of Ethereum's staking yield, prompting a rotation out of ETH into traditional fixed-income assets and exerting downward pressure on the ETH/BTC cross-rate.
Nothing in this material constitutes investment advice, personal recommendation, investment research, an offer, or a solicitation to buy or sell any financial instrument. The content has been prepared without consideration of your individual investment objectives, financial situation, or needs, and should not be treated as such.
Past performance is not a reliable indicator of future performance and/or results. Forward-looking scenarios or forecasts are not a guarantee of future performance. Actual results may differ materially from those anticipated.
Mitrade makes no representation or warranty as to the accuracy or completeness of the information provided and accepts no liability for any loss arising from reliance on such information.
Recommended Articles


