



AbbVie Inc Stock (ABBV) Moved Up by 3.35% on Jul 28: A Full Analysis
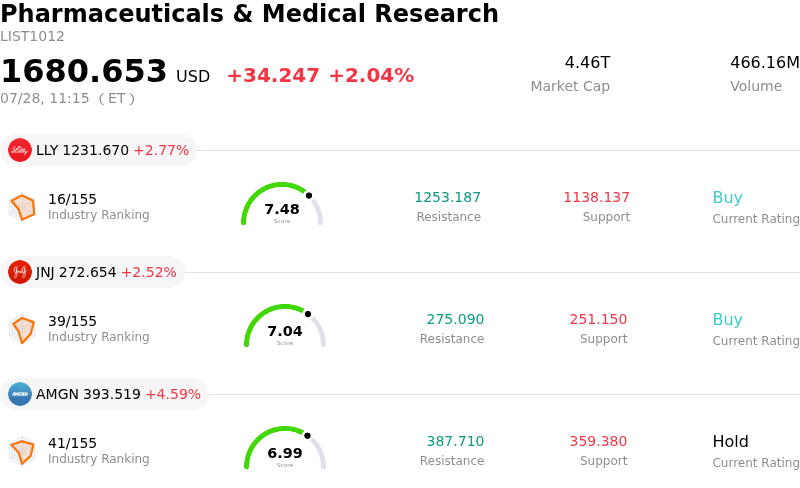
AbbVie Inc (ABBV) moved up by 3.35%. The Pharmaceuticals & Medical Research sector is up by 2.04%. The company outperformed the industry. Top 3 stocks by turnover in the sector: Eli Lilly and Co (LLY) up 2.77%; Johnson & Johnson (JNJ) up 2.52%; Amgen Inc (AMGN) up 4.59%.
What is driving AbbVie Inc (ABBV)’s stock price up today?
AbbVie's positive momentum is largely driven by its second-quarter earnings results, which showcased the company's successful navigation of the post-Humira loss-of-exclusivity landscape. The market responded favorably to the robust growth observed in the immunology portfolio, specifically with Skyrizi and Rinvoq. These two assets have demonstrated significant market share gains across multiple indications, effectively mitigating the revenue contraction from biosimilar competition in the adalimumab market. The ability to maintain high margins despite top-line pressure from legacy products reinforces investor confidence in management's commercial execution and long-term transition strategy.
Beyond existing commercial assets, the company's recent pipeline developments have provided a significant catalyst for the current price movement. Positive top-line data from late-stage clinical trials in the neuroscience and oncology segments have increased the valuation floor for AbbVie's mid-term growth profile. Specifically, the integration of recent strategic acquisitions has begun to yield tangible results, showing a clear path toward diversifying revenue streams away from a single-blockbuster dependency. Institutional investors are particularly encouraged by the progress in the aesthetics division, where core brands are showing resilient consumer demand despite fluctuating macroeconomic conditions.
An upward revision in full-year adjusted earnings guidance further accelerated the buying momentum. By raising its financial outlook, AbbVie signaled to the market that internal cost efficiencies and pipeline productivity are exceeding prior conservative estimates. This proactive transparency often leads to a wave of analyst upgrades and price target adjustments, as seen in the subsequent research notes released by major investment banks today. The company's commitment to dividend growth and strategic capital allocation remains a cornerstone of its investment thesis, attracting defensive capital during periods of intraday volatility.
From a macroeconomic perspective, the healthcare sector is benefiting from a rotation into high-quality, cash-flow-positive equities. As market participants weigh the potential for shifts in federal monetary policy and domestic economic data, AbbVie’s strong balance sheet and essential product mix offer a compelling risk-reward profile. The combination of better-than-expected quarterly financials, a de-risked pipeline, and improved guidance has created a powerful synergy that outweighed lingering concerns regarding regulatory pricing pressures or legislative hurdles in the pharmaceutical industry.
Technical Analysis of AbbVie Inc (ABBV)
Technically, AbbVie Inc (ABBV) shows a MACD (12,26,9) value of -0.920, indicating a neutral signal. The RSI at 62.315 suggests neutral condition and the Williams %R at 27.273 suggests buy condition. Please monitor closely.
Media Coverage of AbbVie Inc (ABBV)
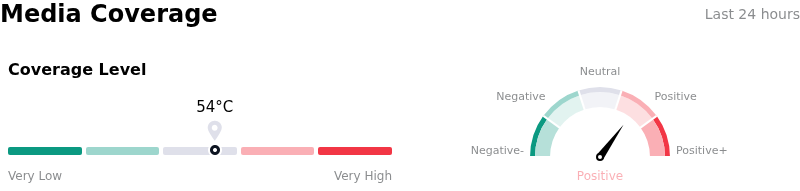
In terms of media coverage, AbbVie Inc (ABBV) shows a coverage score of 54, indicating a moderate level of media attention. The overall market sentiment index is currently in bullish zone.
Fundamental Analysis of AbbVie Inc (ABBV)
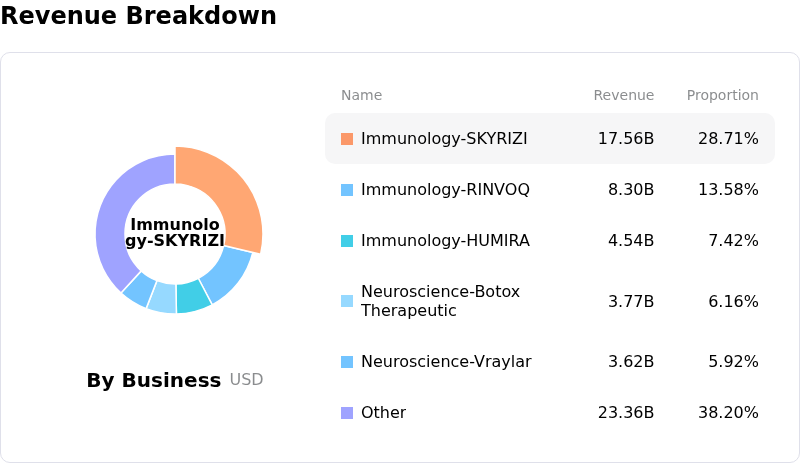
AbbVie Inc (ABBV) is in the Pharmaceuticals & Medical Research industry. Its latest annual revenue is $61.16B, ranking 7 in the industry. The net profit is $4.19B, ranking 15 in the industry. Company Profile
Over the past month, multiple analysts have rated the company as Buy, with an average price target of $266.24, a high of $328.00, and a low of $196.77.
More details about AbbVie Inc (ABBV)
Company Specific Risks:
- Accelerated Humira Revenue Erosion: Increased formulary pressure from major Pharmacy Benefit Managers (PBMs) shifting toward interchangeability-rated biosimilars is threatening the established revenue floor, potentially leading to steeper-than-projected volume losses in the immunology segment.
- High-Cost Pipeline Integration Risks: Following the recent multi-billion dollar acquisitions of ImmunoGen and Cerevel Therapeutics, institutional analysts have flagged concerns over the high cost of R&D integration and the risk of clinical trial setbacks for late-stage assets which are critical to offsetting patent cliff losses.
- Medicare Drug Price Negotiation Exposure: Ongoing regulatory uncertainty regarding the CMS price negotiation results for Imbruvica poses a direct threat to oncology margins, with current market volatility reflecting fears of significant mandatory price cuts starting in the next fiscal cycle.
Nothing in this material constitutes investment advice, personal recommendation, investment research, an offer, or a solicitation to buy or sell any financial instrument. The content has been prepared without consideration of your individual investment objectives, financial situation, or needs, and should not be treated as such.
Past performance is not a reliable indicator of future performance and/or results. Forward-looking scenarios or forecasts are not a guarantee of future performance. Actual results may differ materially from those anticipated.
Mitrade makes no representation or warranty as to the accuracy or completeness of the information provided and accepts no liability for any loss arising from reliance on such information.
Recommended Articles


