



Ripple Price Forecast: XRP sell-off deepens toward $1.00 despite surge in Open Interest
- XRP trades amid renewed headwinds, raising the odds of an extended sell-off toward the $1.00 pivotal support level.
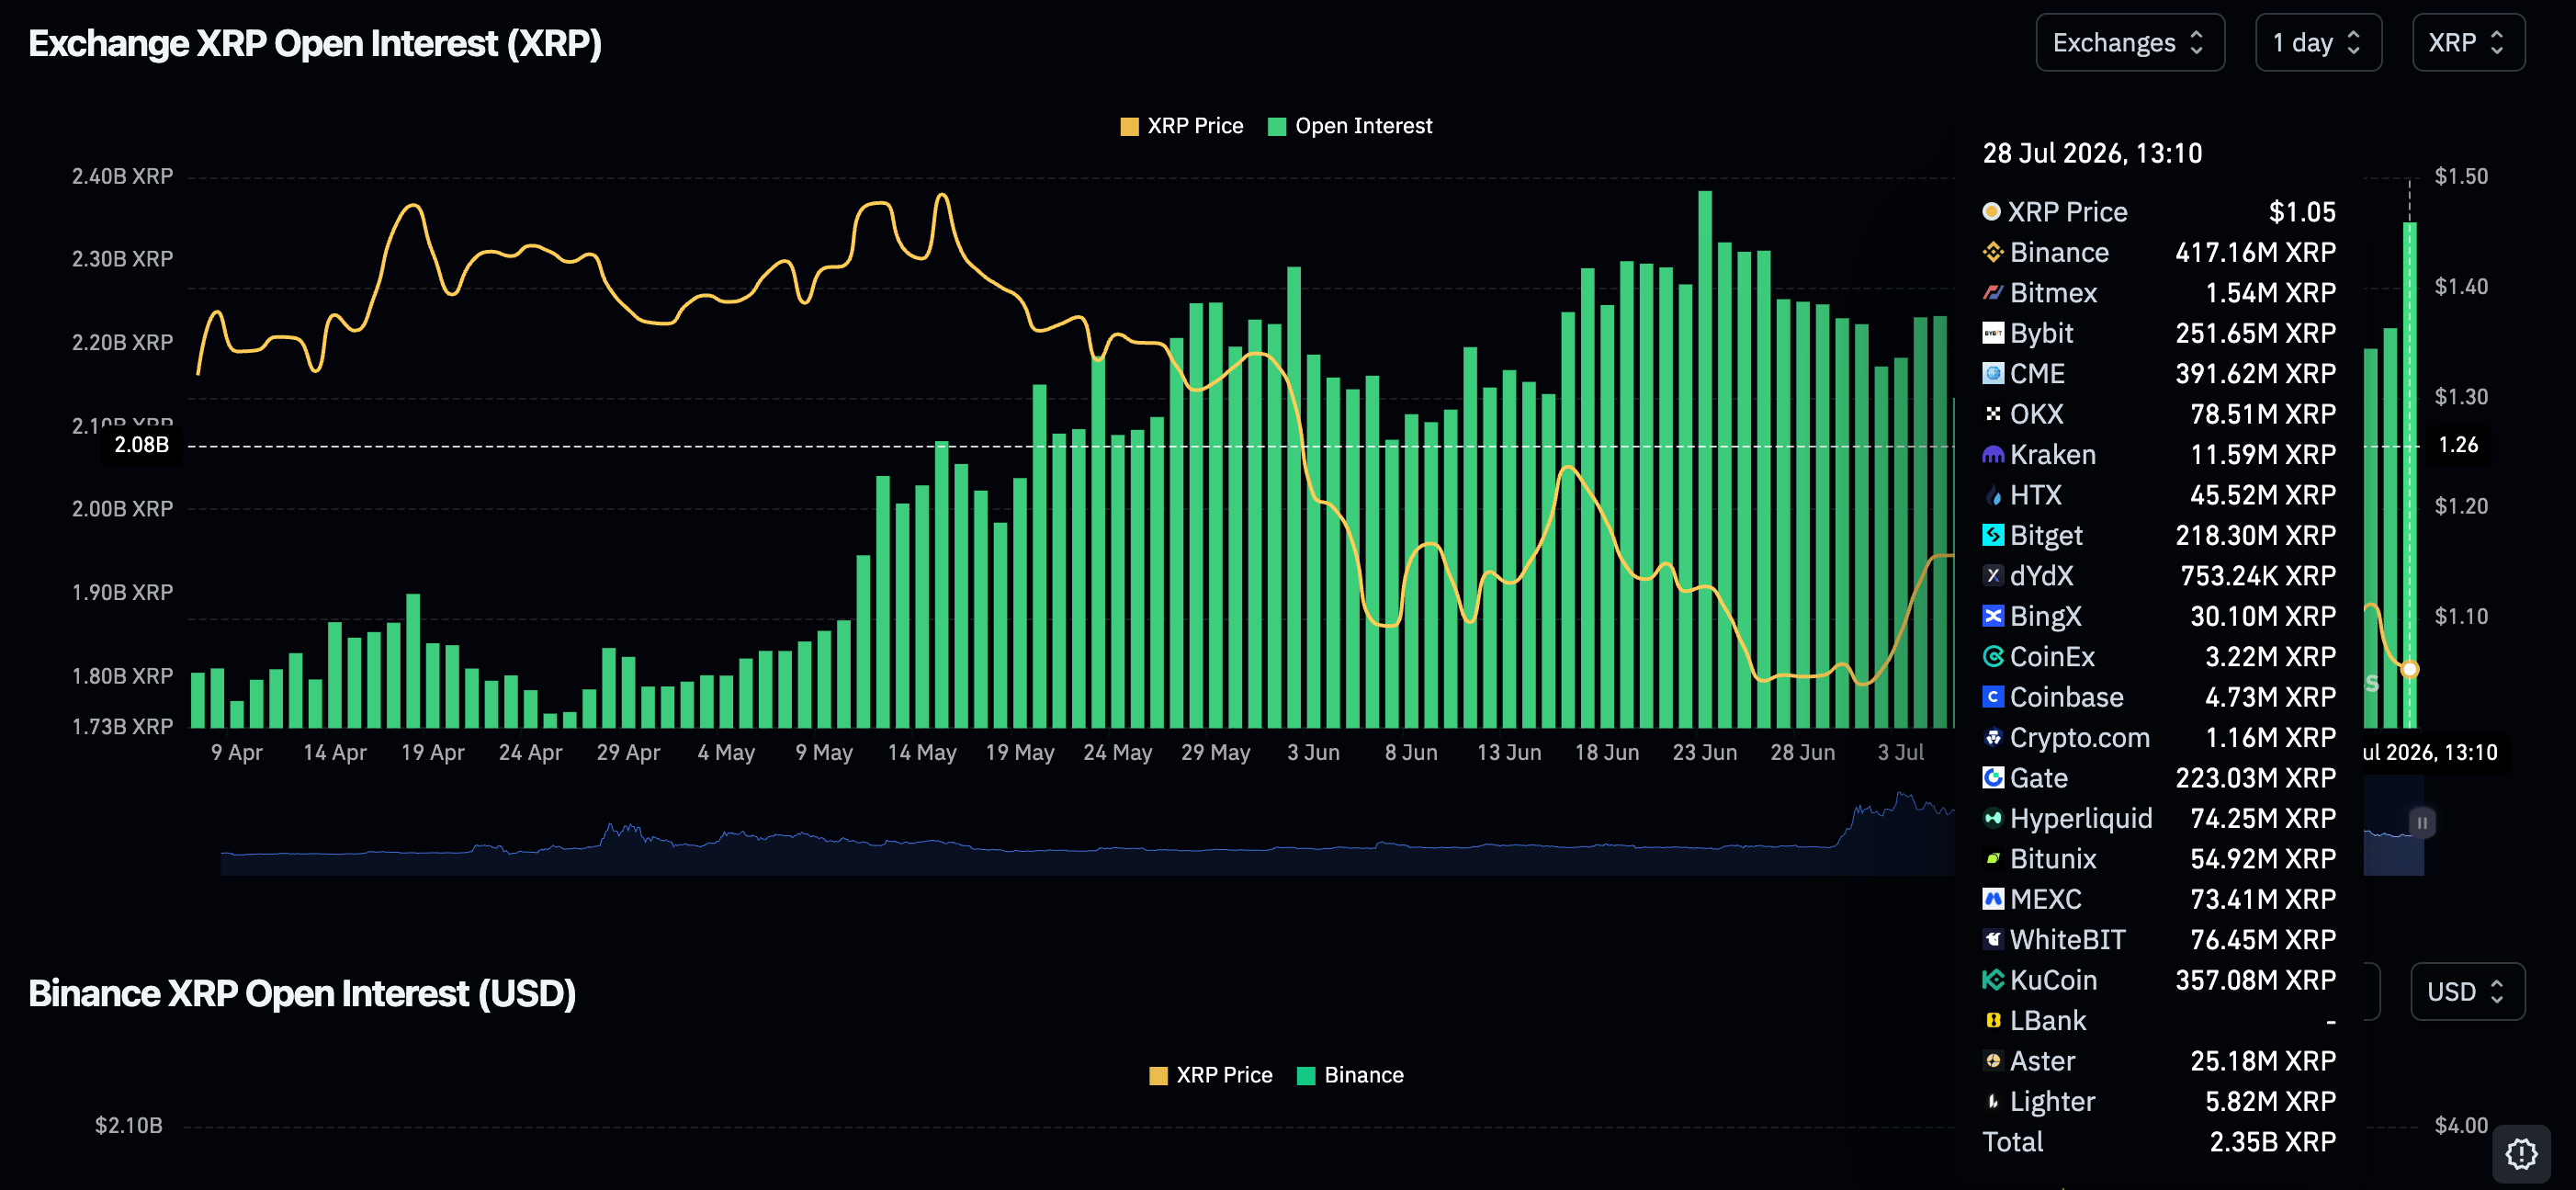
- Demand for derivatives returns, with perpetual futures Open Interest climbing to 2.35 billion XRP.
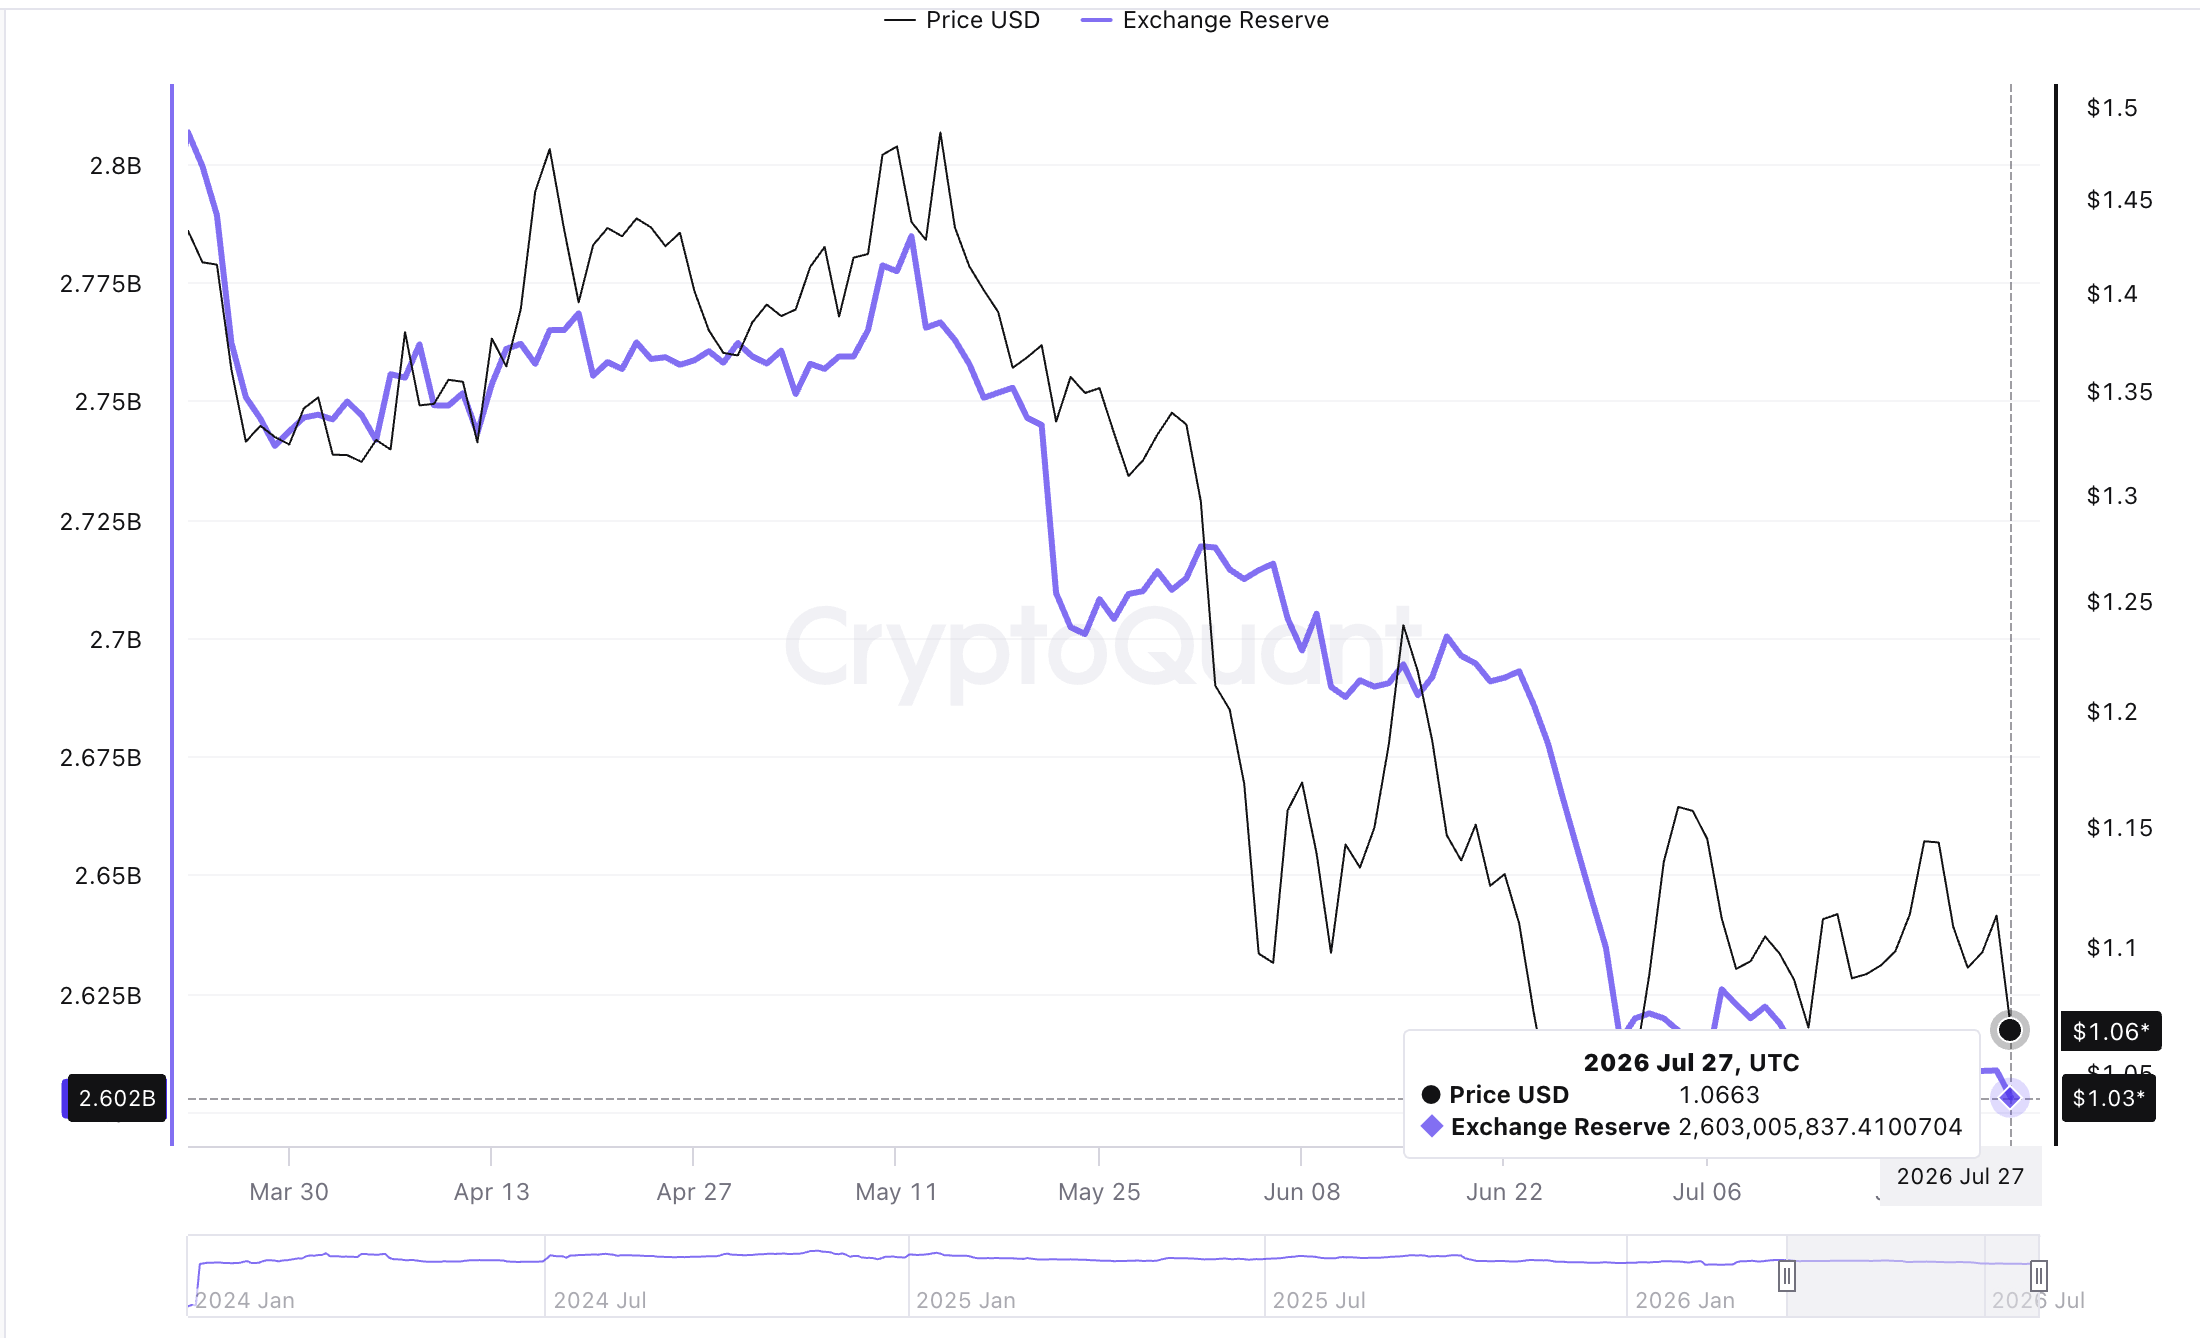
- XRP reserves on Binance edge lower at 2.60 billion XRP, suggesting reduced near-term sell-side liquidity.
Ripple (XRP) continues to trade under increasing pressure on Tuesday. This marks the second consecutive day of declines, reflecting broader risk-off sentiment as investors appear to shift gears in anticipation of the Federal Reserve (Fed) interest rate decision.
Fed rate decision weighs on risk assets
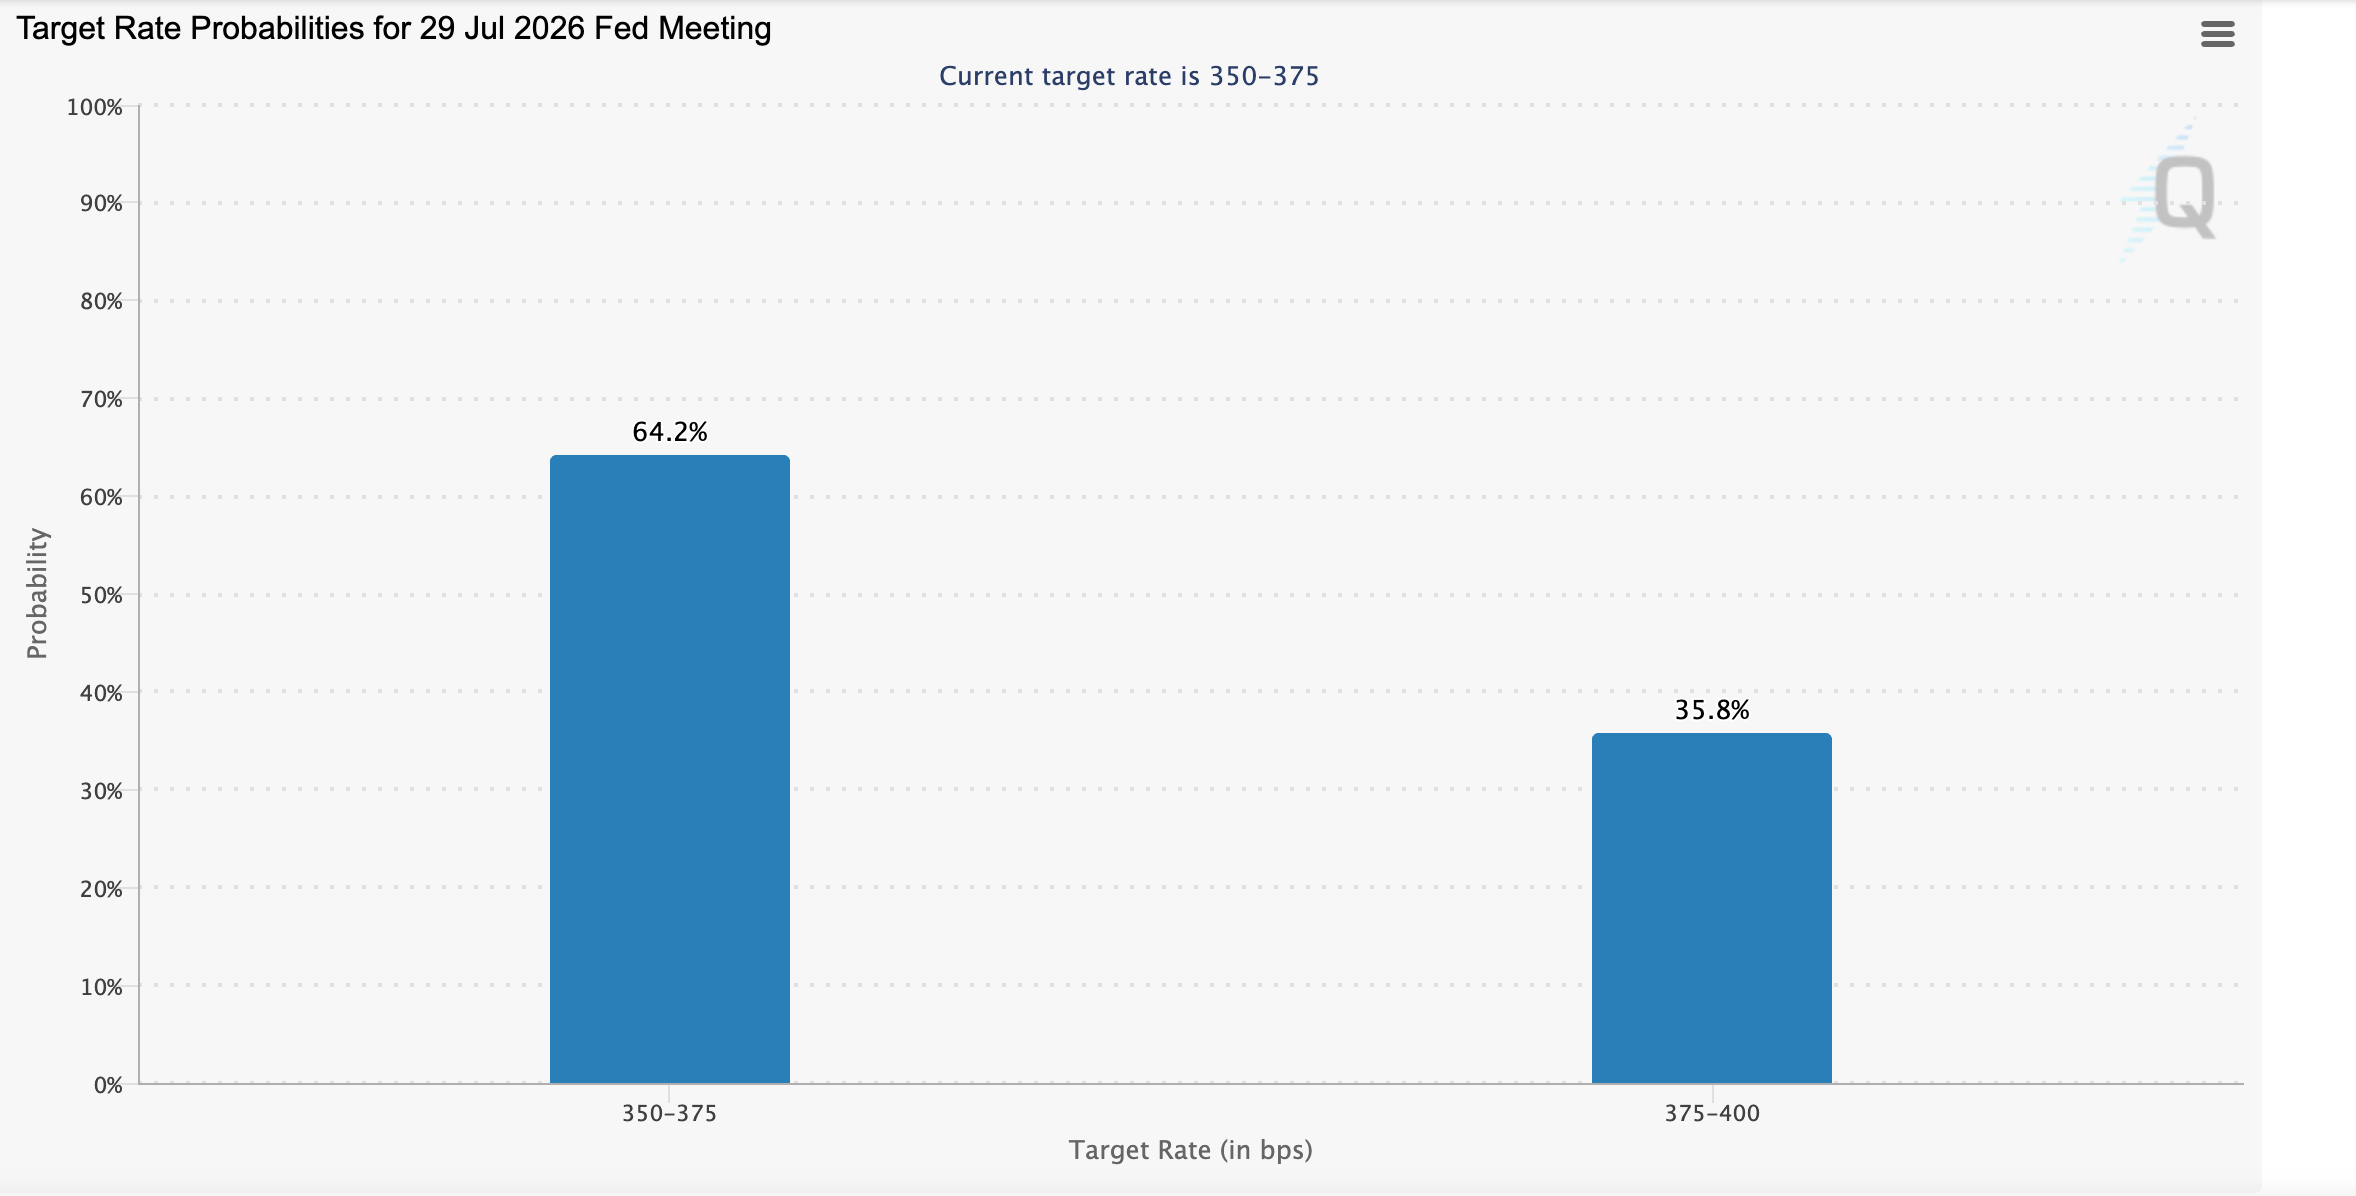
On Wednesday, the Federal Open Market Committee (FOMC) is widely expected to leave interest rates unchanged in the 3.50%-3.75% range. However, the market is pricing in a 36% chance of a rate hike, which could weigh on risk assets.
According to Loretta Mester, former Cleveland Fed President, central bank officials “are going to have to ask themselves whether policy is at the right level to get inflation moving back down to 2%. Chair Warsh has been pretty vocal on saying that they’re not going to tolerate inflation.”
XRP renews retail demand as exchange reserves shrink
Demand for XRP derivatives remains elevated, as futures Open Interest (OI) climbs to 2.25 billion XRP on Tuesday, from 2.22 billion the previous day. If the spike is not an outlier, sustained demand could offset the prevailing selling pressure and stabilize the token ahead of another breakout attempt.
Meanwhile, the balance of XRP reserves on the Binance exchange continues to decline, standing at 2.60 billion XRP as of Monday, down from 2.61 billion the day before. A wider scope highlights a sustained downtrend in supply on the platform, given the 2.71 billion XRP on June 1. Notably, declining reserves imply investors are moving coins off exchanges, resulting in less immediate sell-side pressure.
Technical outlook: XRP bears retain control
XRP trades around $1.05, maintaining a bearish near-term bias as price holds beneath the Bollinger Band middle layer at near $1.10 and well under the 50-day, 100-day and 200-day Exponential Moving Averages (EMAs) at $1.13, $1.22 and $1.42 respectively.
Momentum corroborates the heavy tone, with the Relative Strength Index (RSI) hovering around 39, below the midline on the daily chart, while the Moving Average Convergence Divergence (MACD) histogram has slipped slightly into negative territory, hinting that recent rebounds lack follow-through.
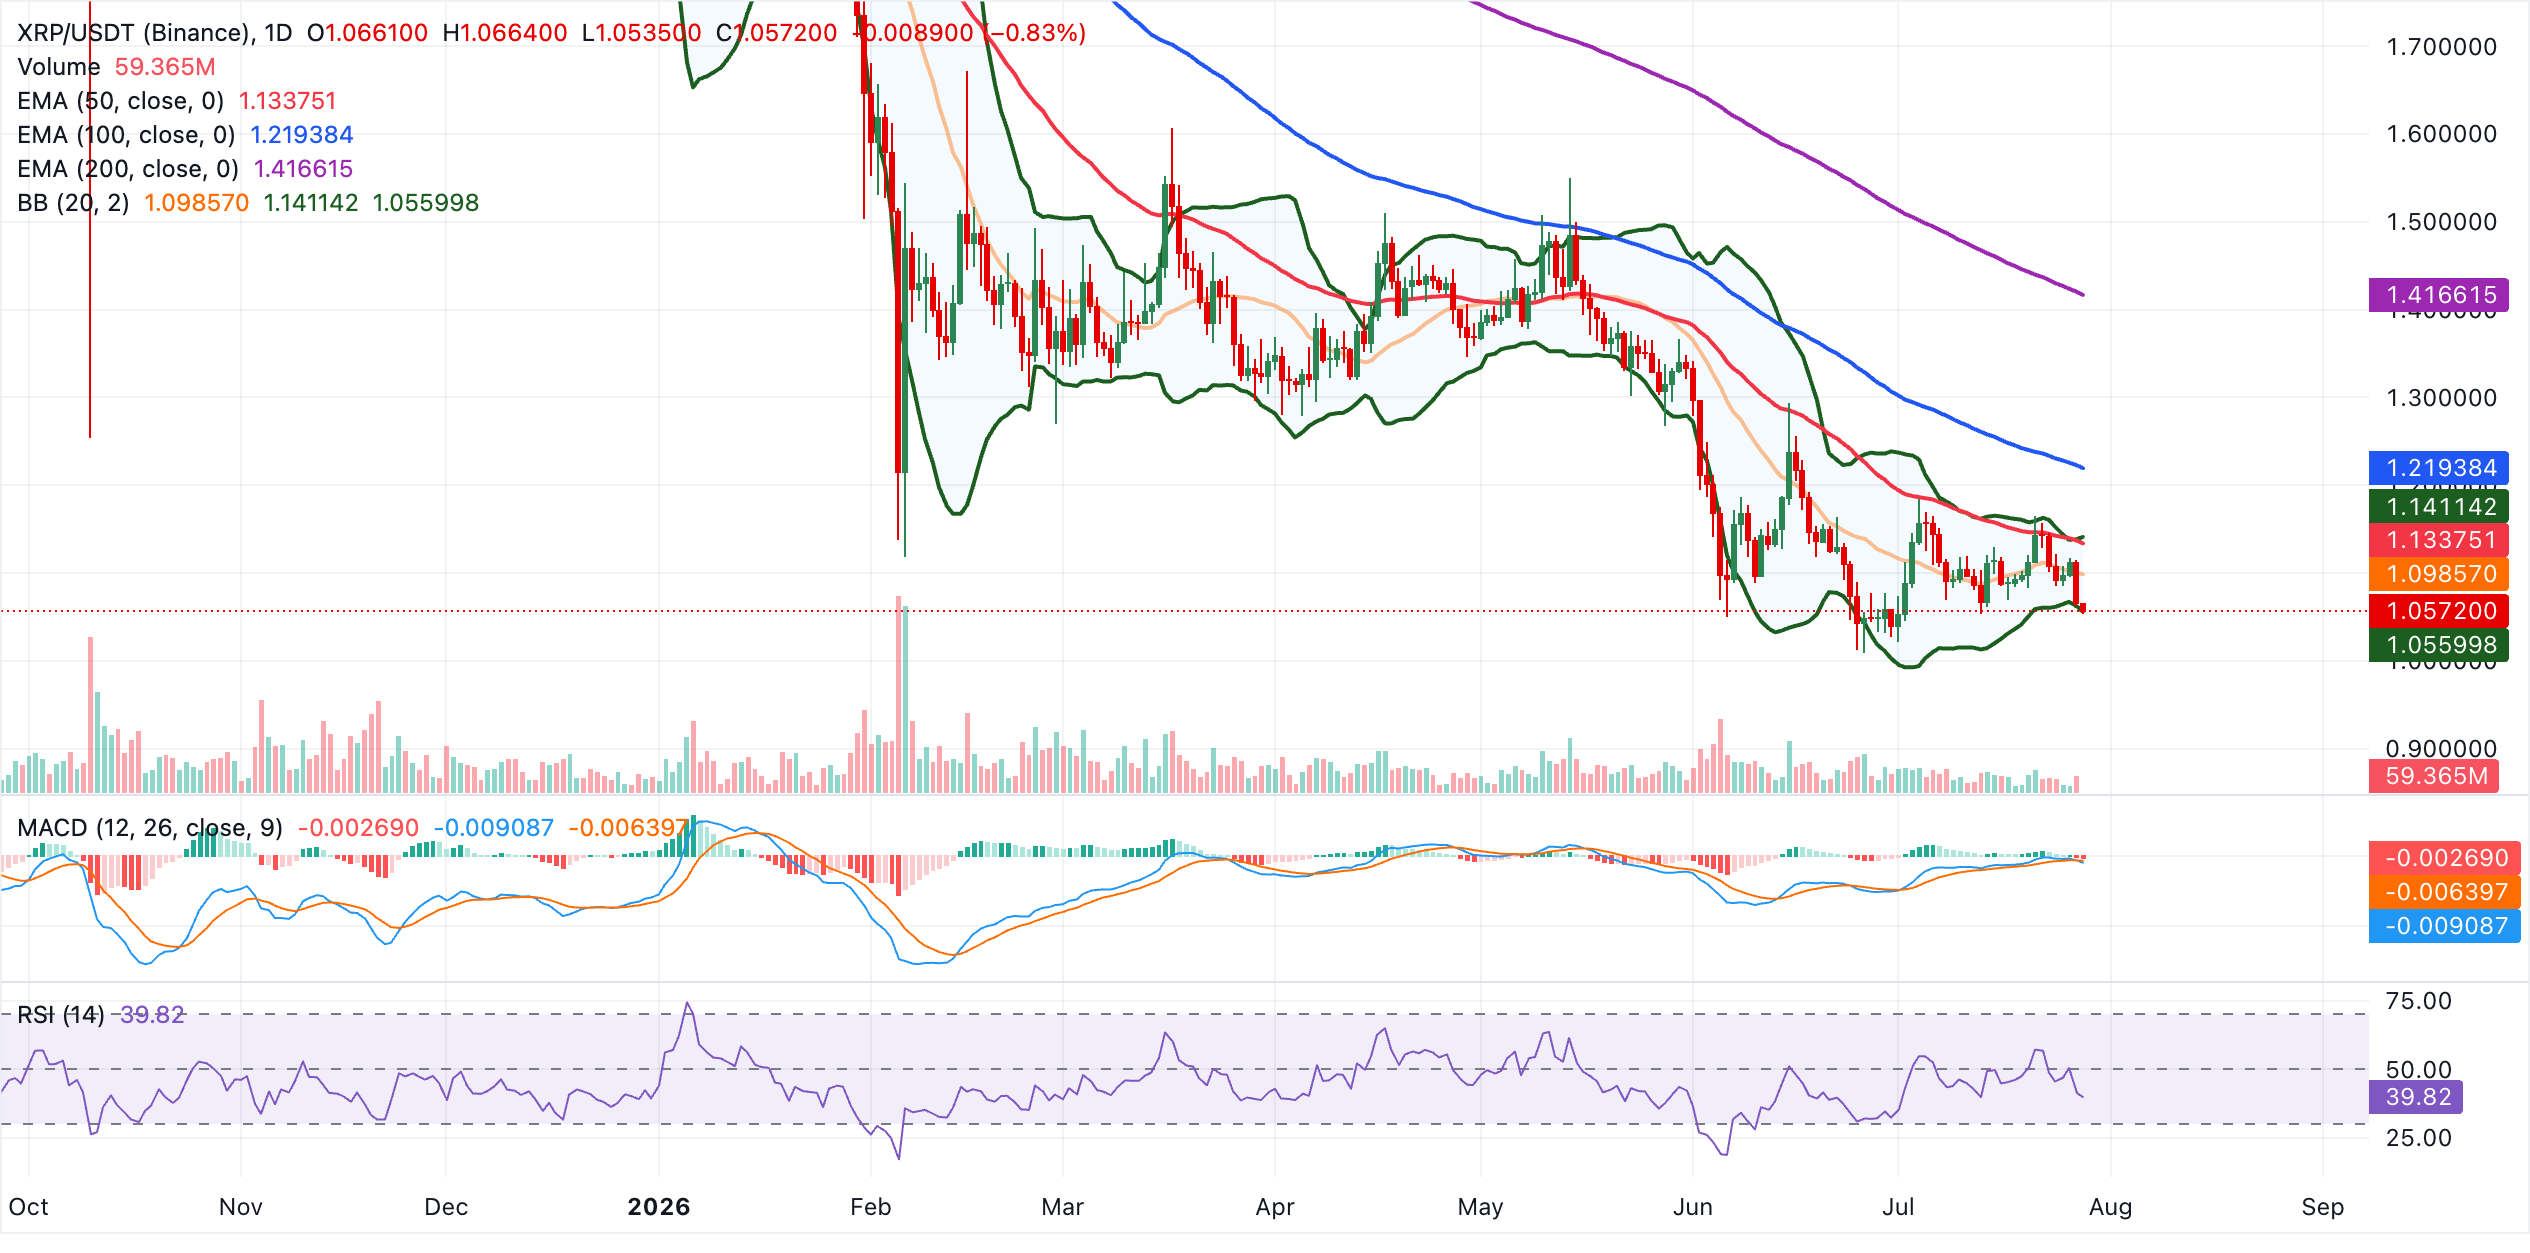
On the downside, immediate support is aligned with the lower Bollinger band near $1.05. A decisive break lower would expose further weakness beyond the band and reinforce the current downleg. On the topside, initial resistance lies at the Bollinger Band middle layer at $1.10, followed by the 50-day EMA near $1.13, while more substantial supply is anticipated higher up at the 100-day EMA around $1.22 and the 200-day EMA near $1.42, levels that would need to be reclaimed to challenge the prevailing bearish structure.
(The technical analysis of this story was written with the help of an AI tool. Know more.)
Open Interest, funding rate FAQs
Higher Open Interest is associated with higher liquidity and new capital inflow to the market. This is considered the equivalent of increase in efficiency and the ongoing trend continues. When Open Interest decreases, it is considered a sign of liquidation in the market, investors are leaving and the overall demand for an asset is on a decline, fueling a bearish sentiment among investors.
Funding fees bridge the difference between spot prices and prices of futures contracts of an asset by increasing liquidation risks faced by traders. A consistently high and positive funding rate implies there is a bullish sentiment among market participants and there is an expectation of a price hike. A consistently negative funding rate for an asset implies a bearish sentiment, indicating that traders expect the cryptocurrency’s price to fall and a bearish trend reversal is likely to occur.
Nothing in this material constitutes investment advice, personal recommendation, investment research, an offer, or a solicitation to buy or sell any financial instrument. The content has been prepared without consideration of your individual investment objectives, financial situation, or needs, and should not be treated as such.
Past performance is not a reliable indicator of future performance and/or results. Forward-looking scenarios or forecasts are not a guarantee of future performance. Actual results may differ materially from those anticipated.
Mitrade makes no representation or warranty as to the accuracy or completeness of the information provided and accepts no liability for any loss arising from reliance on such information.
Recommended Articles


