



$4,000: Gold’s key support faces a crucial Fed test
- Gold falls as a firmer US Dollar outweighs support from declining Oil prices.
- Traders await the Fed interest rate decision on Wednesday, with markets pricing a 35% chance of a surprise rate hike.
- XAU/USD approaches $4,000 support, with RSI on the daily chart holding below the neutral 50 level.
Gold (XAU/USD) trades on the back foot on Tuesday, pressured by a firmer US Dollar (USD), even as Oil prices extend their pullback on hopes of an end to the US-Iran war. At the time of writing, XAU/USD trades around $4,027, down 1.20% on the day, after failing to sustain gains above $4,100 on Monday.
US President Donald Trump said on Monday, “We’re talking with Iran right now. We are having good talks,” adding that there was a “good chance something will happen.” Still, Trump warned that military action could resume if the negotiations fail.
Iran, however, insisted that it was not engaged in direct talks with the United States. Separately, Oman presented Iran with a proposal for the joint management of the Strait of Hormuz through “voluntary fees,” under which Iran would not have sole control of the key shipping route.
Oil prices have erased all the gains recorded last week, with West Texas Intermediate (WTI) trading around $80.30, extending its decline for a third consecutive day. Despite the sharp pullback, Oil prices remain elevated and continue to fuel inflation concerns.
While the US-Iran war stays at the forefront, attention is also turning to the Federal Reserve’s (Fed) interest-rate decision on Wednesday, which carries an unusually high risk of a surprise rate hike.
The Fed is widely expected to keep the federal funds rate unchanged at 3.50%-3.75%. However, according to the CME FedWatch Tool, traders price in around a 35% chance of a 25-basis-point (bps) increase.
Hawkish bets have strengthened since Fed Chair Kevin Warsh led his first policy meeting in June. Warsh has repeatedly stressed the need to restore price stability as inflation runs above the 2% target.
Will $4,000 hold or break?
For Gold, the upcoming Fed decision could prove pivotal in determining whether the $4,000 support holds or gives way to a deeper corrective decline.
A surprise rate hike would put Gold at risk of falling below $4,000. Higher borrowing costs typically weigh on non-yielding assets while boosting the US Dollar and US Treasury yields.
The base case is a hawkish hold, with the Fed leaving rates unchanged while keeping the door open to an increase later this year as energy-driven inflation risks persist without a lasting resolution to the US-Iran war. Such an outcome could also leave Gold vulnerable to a break below $4,000.
Meanwhile, if the Fed adopts a less hawkish stance and views the energy shock as temporary, traders may scale back rate-hike bets. That could weaken the US Dollar and help Gold hold above the $4,000 support.
Technical analysis: Bears retain control below middle Bollinger Band
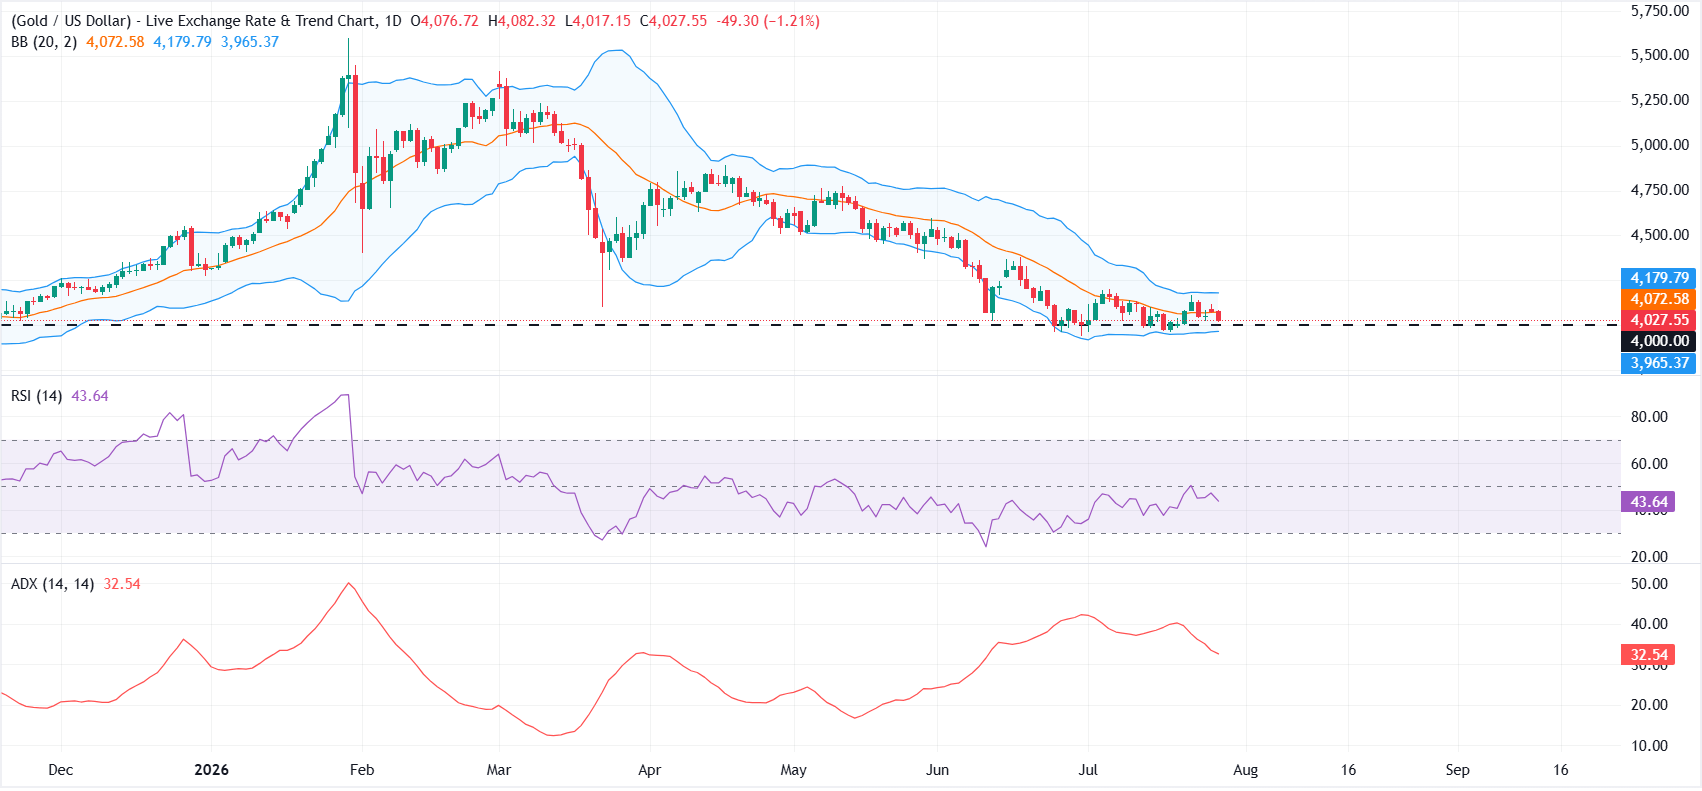
On the daily chart, XAU/USD maintains a mildly bearish near-term bias as it trades below the 20-day Simple Moving Average (SMA) at around $4,072, which also represents the middle Bollinger Band.
The band structure shows spot trading in the lower half of the envelope, while the Relative Strength Index (RSI) at 43.42 stays below the neutral 50 level, suggesting that recovery attempts lack strong momentum within a still‑pressured trend backdrop flagged by an Average Directional Index (ADX) near 32, which signals persistent but moderating trend strength.
On the topside, initial resistance emerges at the Bollinger middle band and 20‑day SMA near $4,072, followed by the upper band around $4,179, where sellers could reassert control if tested.
On the downside, immediate support is seen at the psychological $4,000 handle, ahead of the lower Bollinger band near $3,964. A daily close below this latter floor would expose deeper losses and reinforce the prevailing bearish bias.
(The technical analysis of this story was written with the help of an AI tool. Know more.)
Fed FAQs
Monetary policy in the US is shaped by the Federal Reserve (Fed). The Fed has two mandates: to achieve price stability and foster full employment. Its primary tool to achieve these goals is by adjusting interest rates. When prices are rising too quickly and inflation is above the Fed’s 2% target, it raises interest rates, increasing borrowing costs throughout the economy. This results in a stronger US Dollar (USD) as it makes the US a more attractive place for international investors to park their money. When inflation falls below 2% or the Unemployment Rate is too high, the Fed may lower interest rates to encourage borrowing, which weighs on the Greenback.
The Federal Reserve (Fed) holds eight policy meetings a year, where the Federal Open Market Committee (FOMC) assesses economic conditions and makes monetary policy decisions. The FOMC is attended by twelve Fed officials – the seven members of the Board of Governors, the president of the Federal Reserve Bank of New York, and four of the remaining eleven regional Reserve Bank presidents, who serve one-year terms on a rotating basis.
In extreme situations, the Federal Reserve may resort to a policy named Quantitative Easing (QE). QE is the process by which the Fed substantially increases the flow of credit in a stuck financial system. It is a non-standard policy measure used during crises or when inflation is extremely low. It was the Fed’s weapon of choice during the Great Financial Crisis in 2008. It involves the Fed printing more Dollars and using them to buy high grade bonds from financial institutions. QE usually weakens the US Dollar.
Quantitative tightening (QT) is the reverse process of QE, whereby the Federal Reserve stops buying bonds from financial institutions and does not reinvest the principal from the bonds it holds maturing, to purchase new bonds. It is usually positive for the value of the US Dollar.
Nothing in this material constitutes investment advice, personal recommendation, investment research, an offer, or a solicitation to buy or sell any financial instrument. The content has been prepared without consideration of your individual investment objectives, financial situation, or needs, and should not be treated as such.
Past performance is not a reliable indicator of future performance and/or results. Forward-looking scenarios or forecasts are not a guarantee of future performance. Actual results may differ materially from those anticipated.
Mitrade makes no representation or warranty as to the accuracy or completeness of the information provided and accepts no liability for any loss arising from reliance on such information.
Recommended Articles


