



EUR/USD Price Forecast: Under pressure with YTD lows at 1.1324 coming closer
- EUR/USD hits fresh monthly lows below 1.1360, drifting closer to 13-month lows at 1.1324.
- A mild risk appetite amid lower Oil prices has failed to support the Euro.
- The US Dollar rallies to fresh highs amid hopes of a surprise Fed rate hike on Thursday.
The Euro (EUR) is failing to draw any significant support from the truce in the Middle East and the lower Oil prices and keeps heading south against the US Dollar (USD) on Tuesday. EUR/USD bears are testing fresh one-month lows below 1.1360, drawing near the year-to-date low of 1.1324.
Market optimism about a negotiated end of the US-Iran conflict and the 12% decline in Brent Oil prices have triggered a mild appetite for risk during the European session, with European stock markets showing marginal gains following a negative session in Asia.
Risk appetite, however, has not translated into a weaker US Dollar this time, as traders cling to hopes that the Federal Reserve (Fed) might deliver a surprise rate hike later this week. Futures markets are pricing a 35% chance of a 25 basis point hike on Thursday, up from 25% a week ago, according to data by the CME Group’s FedWatch Tool, underpinning support for the US Dollar, which has reached fresh monthly highs against a basket of currencies.
Technical Analysis: Below 1.1324, the next target is the 1.1245 area
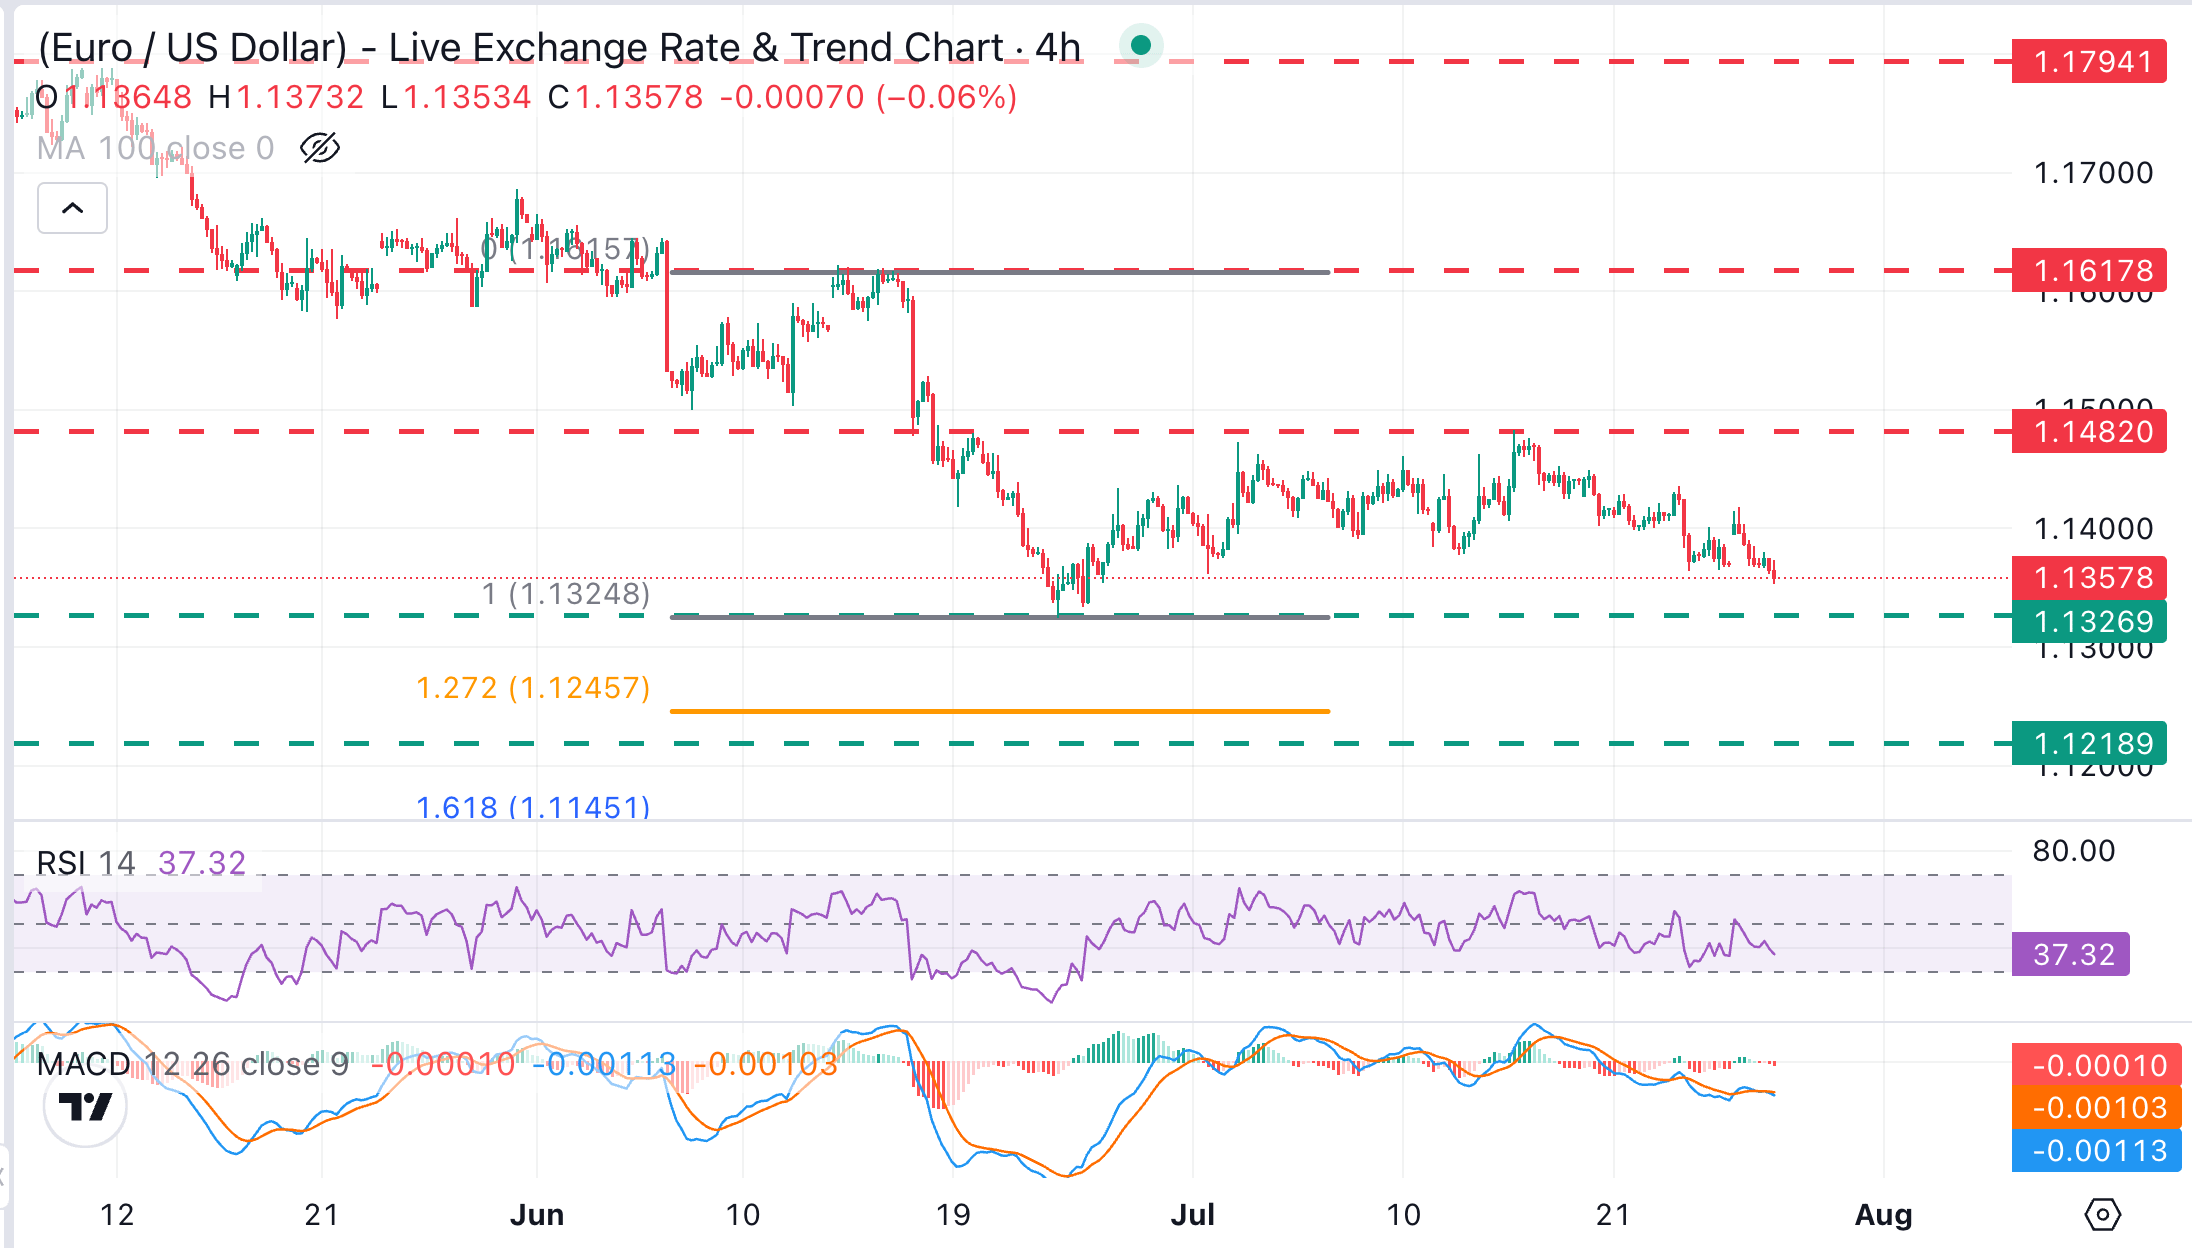
EUR/USD trades at 1.1362, holding a mild bearish trend, after being rejected at the 1.1420 area on Monday, with price action approaching year-to-date lows. The 4-hour Relative Strength Index (14) is pulling lower from the neutral 50 line, and the Moving Average Convergence Divergence (MACD) has entered negative levels although it remains near zero. Momentum is flat to slightly bearish, rather than impulsively directional so far.
If the pair confirms below the bottom of the monthly channel at 1.1360, bears are likely to be tempted by the 2026 trading floor of 1.1324. Below here, the area between the 127.2% Fibonacci extension of the June 17-24 sell-off, at 1.1245, and the late May 2025 low, at 1.1210, emerges as the next target.
On the topside, Monday's high, at 1.1420, and the top of the monthly range at 1.1480 are the key levels to breach to ease bearish pressure.
(The technical analysis of this story was written with the help of an AI tool. Know more.)
Nothing in this material constitutes investment advice, personal recommendation, investment research, an offer, or a solicitation to buy or sell any financial instrument. The content has been prepared without consideration of your individual investment objectives, financial situation, or needs, and should not be treated as such.
Past performance is not a reliable indicator of future performance and/or results. Forward-looking scenarios or forecasts are not a guarantee of future performance. Actual results may differ materially from those anticipated.
Mitrade makes no representation or warranty as to the accuracy or completeness of the information provided and accepts no liability for any loss arising from reliance on such information.
Recommended Articles


