


CFDs are complex instruments and come with a high risk of losing money rapidly due to leverage. 80% of retail investor accounts lose money when trading CFDs with this provider. You should consider whether you understand how CFDs work and whether you can afford to take the high risk of losing your money.

Pi Network Price Forecast: PI declines further, risking fresh record lows

Source Fxstreet
  • Pi Network extends losses on Tuesday, following a roughly 7% decline the previous day.
  • Crypto market sentiment deteriorates, weighing on community-driven tokens.
  • The technical outlook for PI is bearish, with next support at the $0.0700 record low.

Pi Network (PI) price is trading in the red on Tuesday, extending losses after a 7% decline the previous day. The PI token faces intense downside pressure as broader crypto market sentiment deteriorates, risking a steeper decline below the record low of $0.0700. 

Pi Network risks further downside as the crypto market sentiment declines

The broader crypto market faces renewed selling pressure this week. CoinGlass data shows $604 million in total liquidation, led by $531 million of long liquidation, reflecting a sell-side bias. 
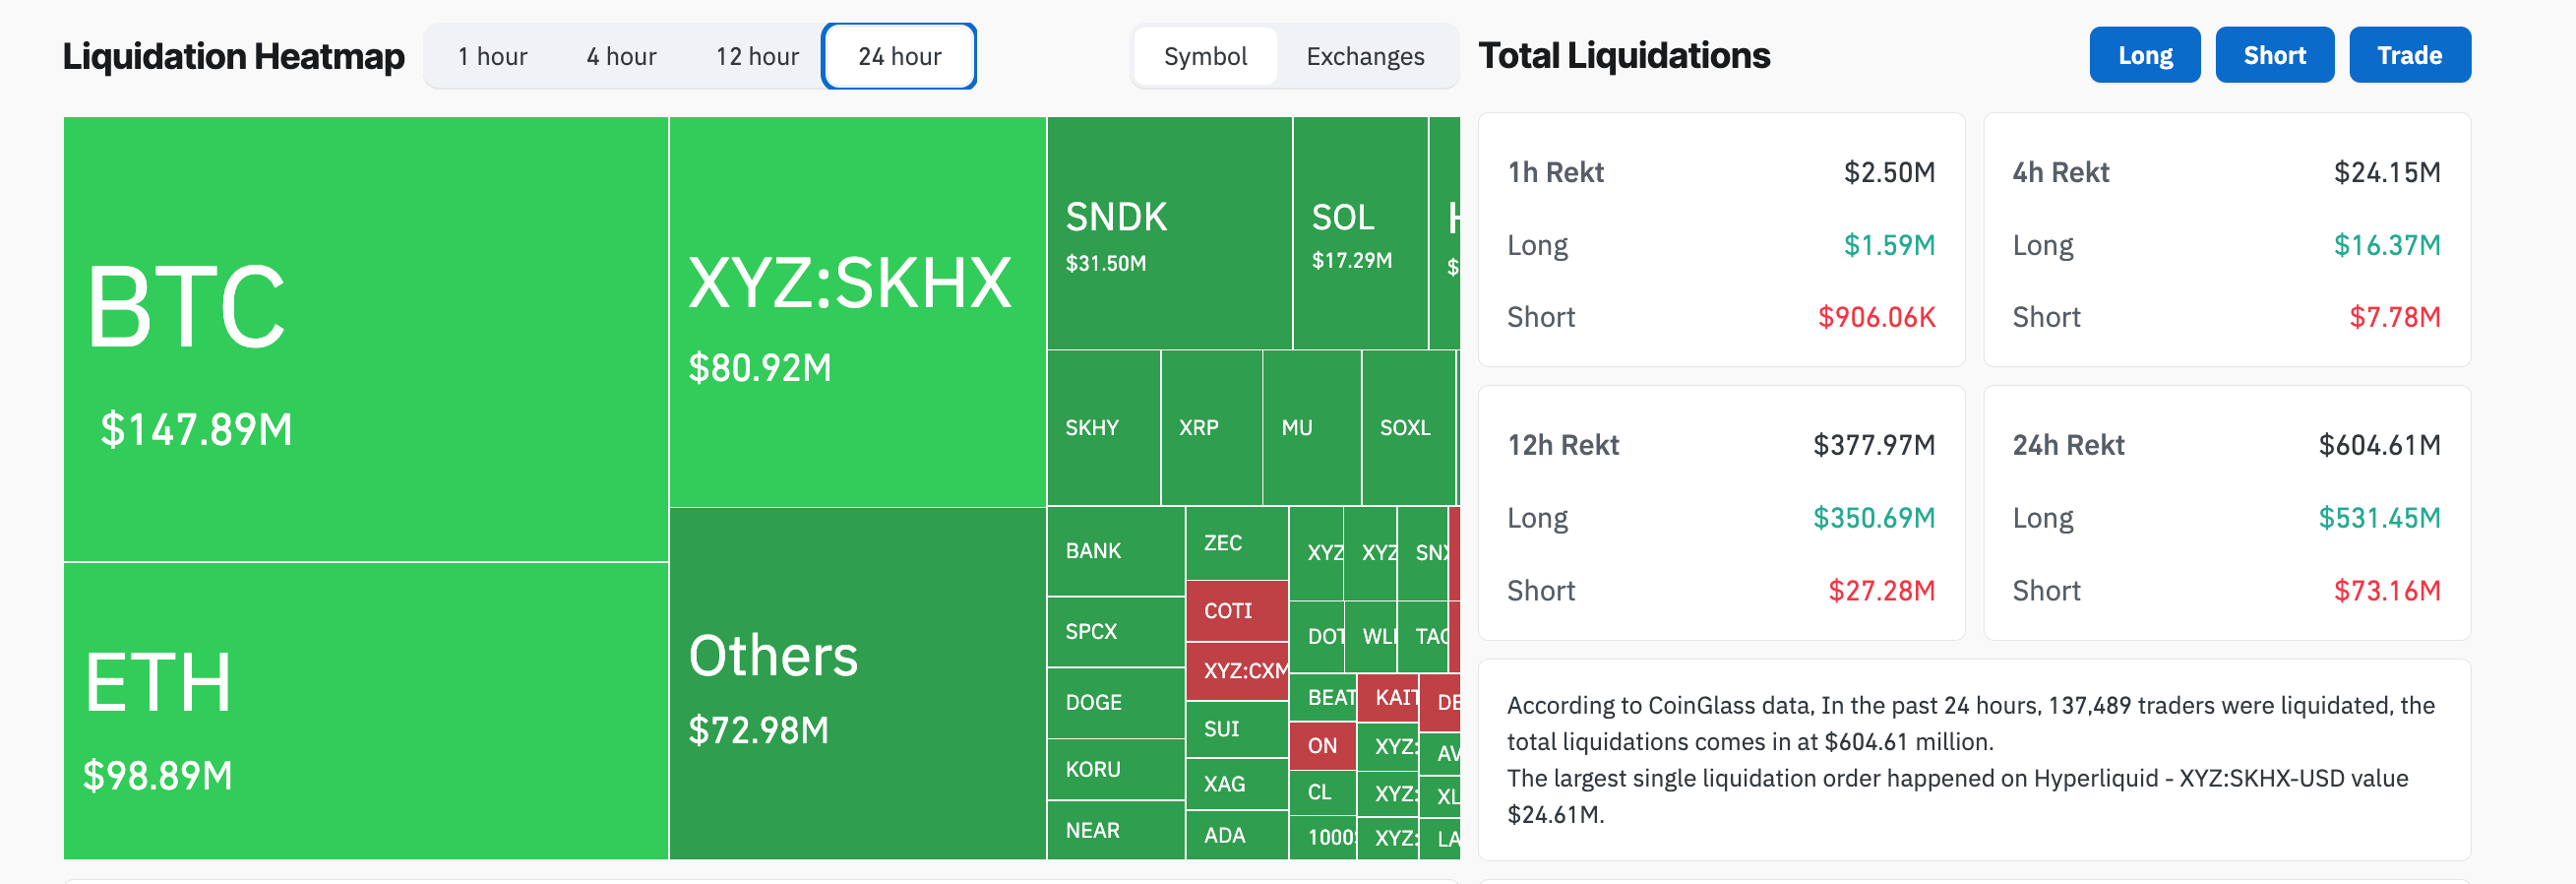
Crypto liquidation data. Source: CoinGlass

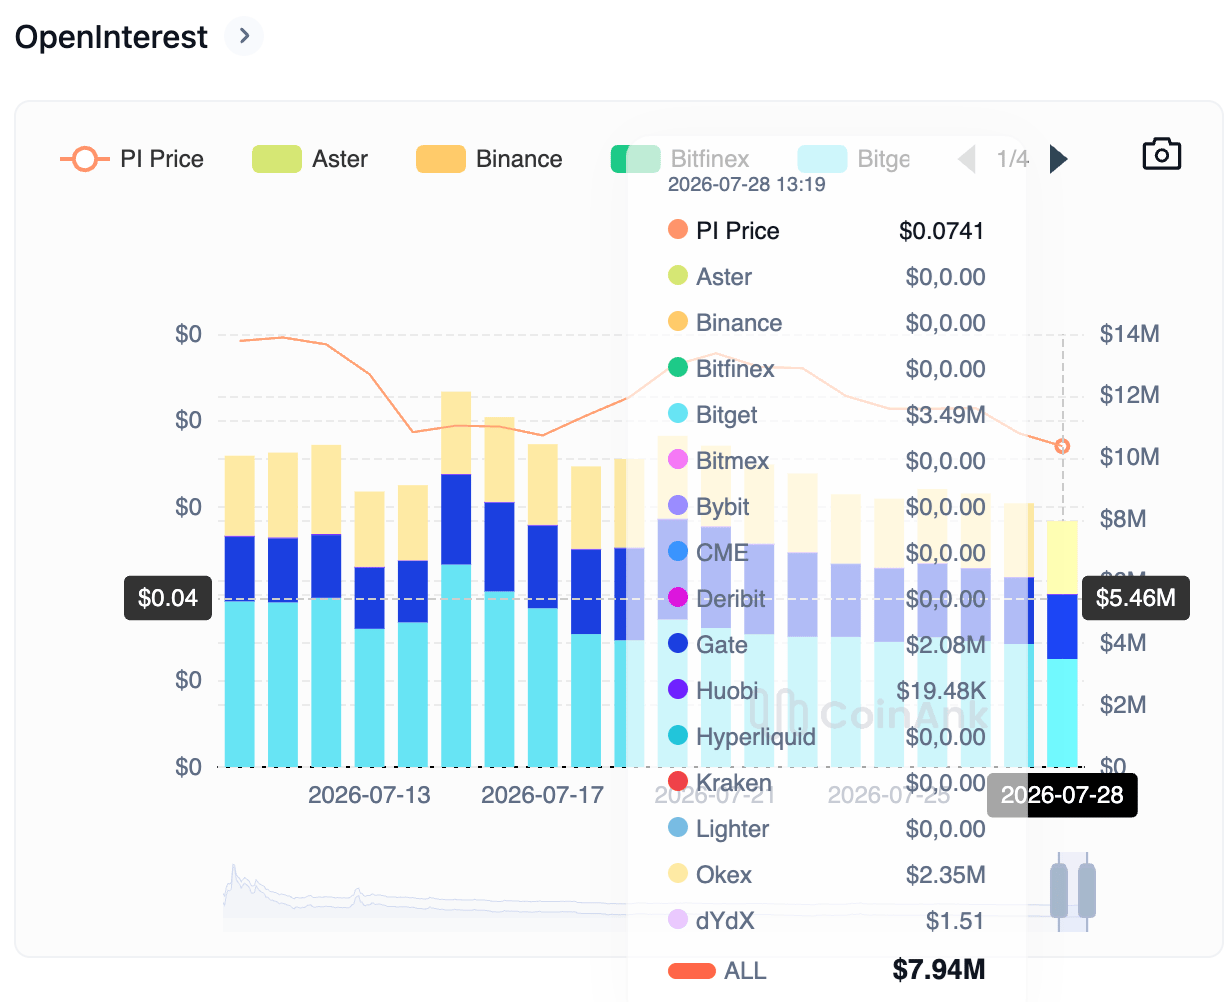
At the same time, CoinMarketCap’s Fear and Greed Index is at 34, down from 39 on Sunday as the market sentiment shifts risk-off from neutral. Given the strong correlation between the PI token and crypto market sentiment, risk-off conditions increase downside risk. CoinAnk data show a steady decline in PI Open Interest (OI) to $7.94 million, down from $12.14 million on July 15.
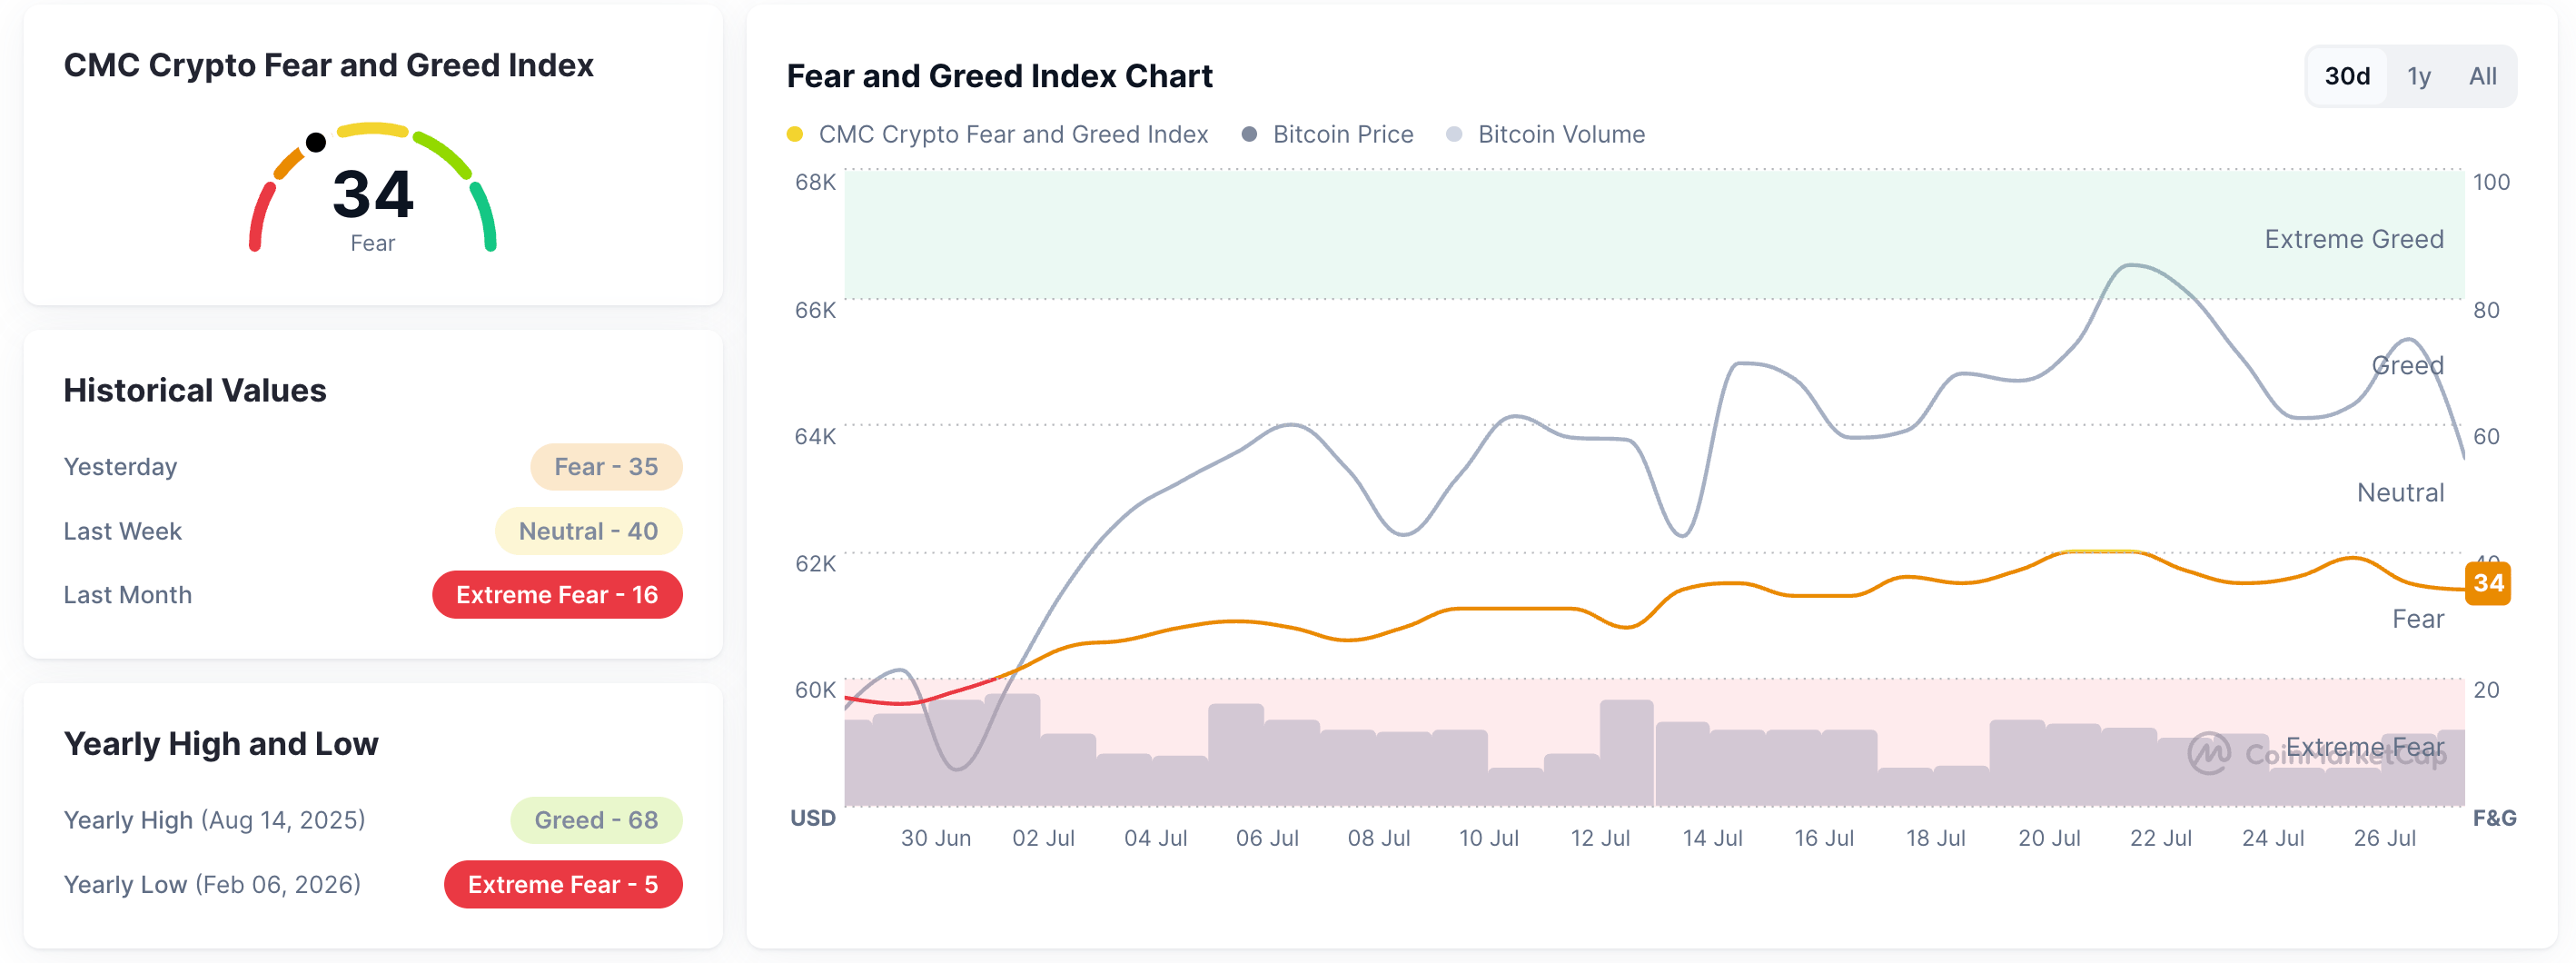
Fear and Greed Index. Source: CoinMarketCap
PI token Open Interest chart. Source: CoinAnk

How low will Pi Network go?

Pi Network maintains a bearish near-term bias as price remains well below the 50- and 200-day Exponential Moving Averages (EMAs) at $0.1064 and $0.1719, respectively. From a technical perspective, PI has been trending downward within a falling channel pattern on the daily chart for roughly three months.

The PI token has shown a steady decline over the last week, approaching its recent low of $0.0700. A sustained close below this level could target the 200% Fibonacci extension level at $0.0368, measured from $0.1998 to $0.1183.

The Directional Movement Index shows a widening gap between the negative and positive DI lines, while the ADX line stabilizes near 39, hinting at renewed momentum.
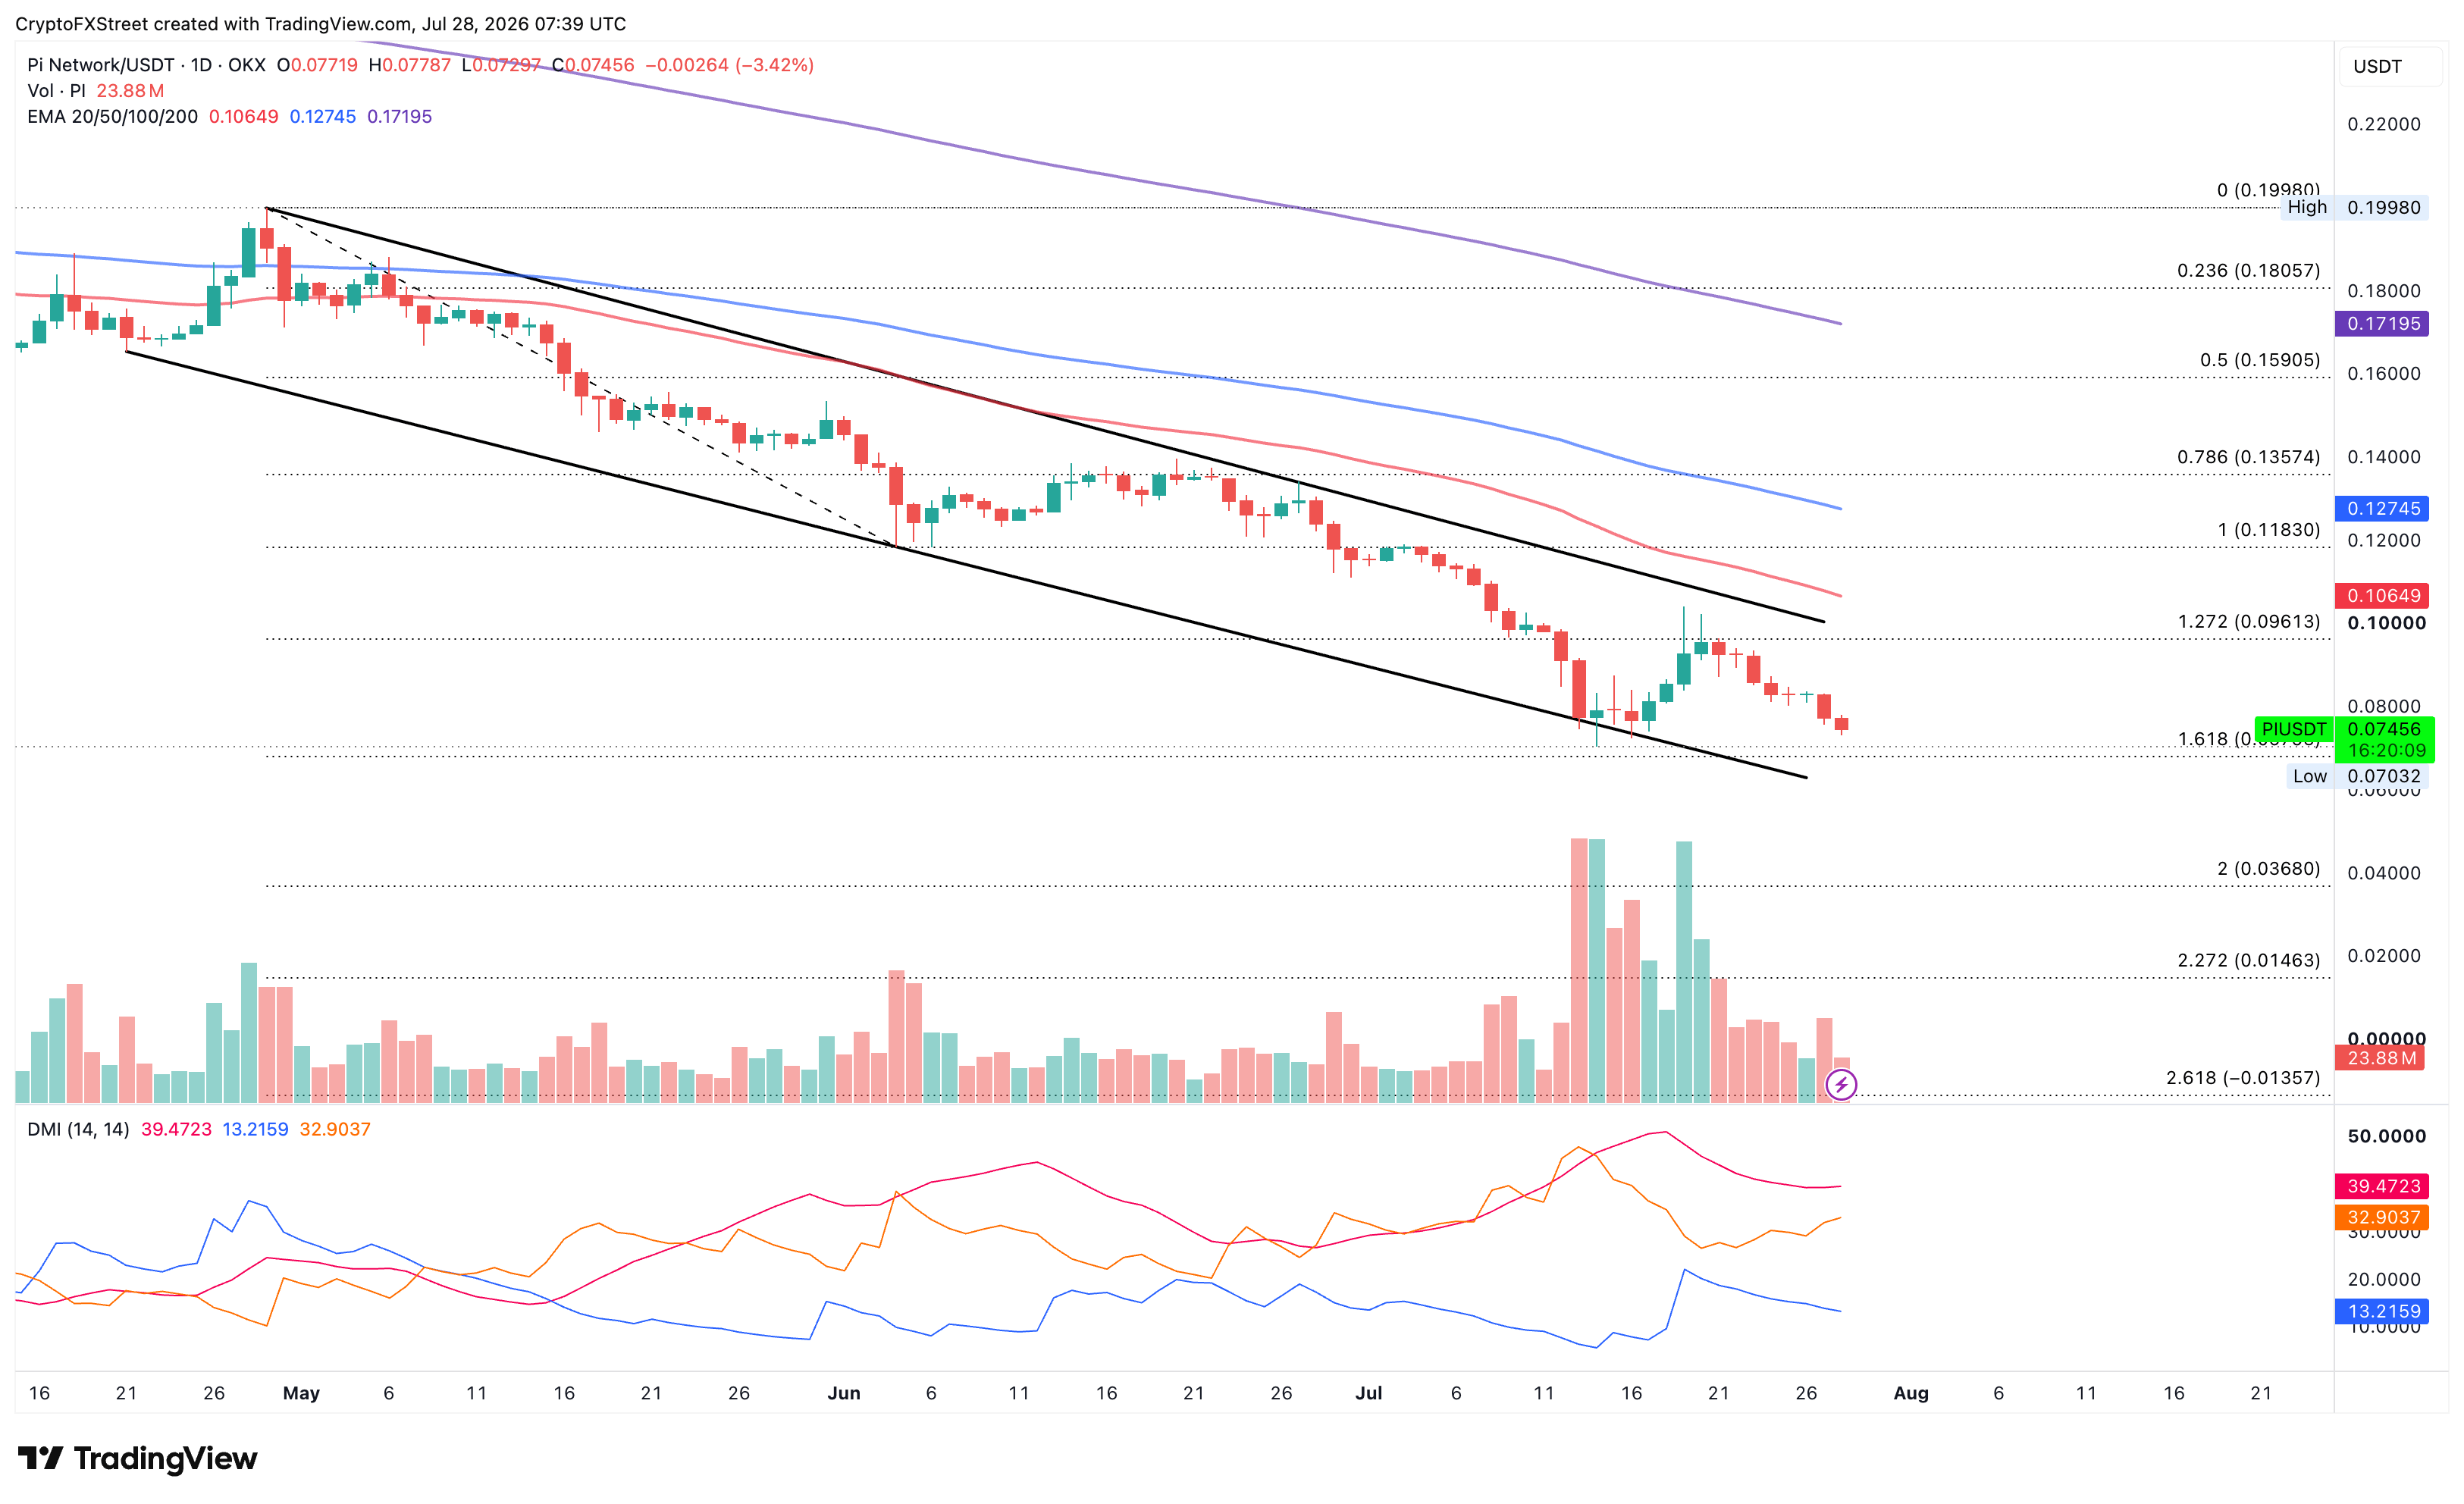
PI/USDT daily price chart.

On the topside, initial resistance is located at the 127.2% Fibonacci extension level at $0.0961, followed by the overhead trendline near the $0.1000 psychological mark.

(The technical analysis of this story was written with the help of an AI tool. Know more.)

Disclaimer: The content available on Mitrade Insights is provided for informational and marketing purposes only. It has not been prepared in accordance with legal requirements designed to promote the independence of investment research and is not subject to any prohibition on dealing ahead of the dissemination of investment research
Nothing in this material constitutes investment advice, personal recommendation, investment research, an offer, or a solicitation to buy or sell any financial instrument. The content has been prepared without consideration of your individual investment objectives, financial situation, or needs, and should not be treated as such.
Past performance is not a reliable indicator of future performance and/or results. Forward-looking scenarios or forecasts are not a guarantee of future performance. Actual results may differ materially from those anticipated.
Mitrade makes no representation or warranty as to the accuracy or completeness of the information provided and accepts no liability for any loss arising from reliance on such information.
placeholder
India Gold price today: Gold falls, according to FXStreet dataGold prices fell in India on Thursday, according to data compiled by FXStreet.
Author  FXStreet
Nov 27, 2025
Gold prices fell in India on Thursday, according to data compiled by FXStreet.
placeholder
Financial Markets 2026: Volatility Catalysts in Gold, Silver, Oil, and Blue-Chip Stocks—A CFD Trader's OutlookThe financial world is perpetually in motion, but the landscape for 2026 seems to be shaping up to be particularly dynamic. For CFD traders navigating global markets, this heightened volatility could present a distinctive set of challenges and opportunities.
Author  Rachel Weiss
May 18, Mon
The financial world is perpetually in motion, but the landscape for 2026 seems to be shaping up to be particularly dynamic. For CFD traders navigating global markets, this heightened volatility could present a distinctive set of challenges and opportunities.
placeholder
Silver Price Forecasts: XAG/USD rises beyond $87.00 after a two-day selloffSilver (XAG/USD) shows moderate gains on Tuesday, trading at $87.05 at the time of writing. The white metal found some footing after plummeting more than 30% in the previous two trading days, hitting one-month lows right below the $72.00 line.
Author  FXStreet
Feb 03, Tue
Silver (XAG/USD) shows moderate gains on Tuesday, trading at $87.05 at the time of writing. The white metal found some footing after plummeting more than 30% in the previous two trading days, hitting one-month lows right below the $72.00 line.
placeholder
Silver price today: Silver rises, according to FXStreet dataSilver prices (XAG/USD) rose on Monday, according to FXStreet data. Silver trades at $81.78 per troy ounce, up 5.54% from the $77.48 it cost on Friday.
Author  FXStreet
Feb 09, Mon
Silver prices (XAG/USD) rose on Monday, according to FXStreet data. Silver trades at $81.78 per troy ounce, up 5.54% from the $77.48 it cost on Friday.
placeholder
The Trumponomics Ebook: Oil Price Volatility in the Iran War Understand how the Strait of Hormuz shock moved markets, and what CFD traders watched next.
Author  Rachel Weiss
May 25, Mon
Understand how the Strait of Hormuz shock moved markets, and what CFD traders watched next.
goTop
quote