



WTI Futures (USOIL-F) Drops on Aug 13: Key Factors to Watch
WTI Futures (USOIL-F) is down 2.00% at Aug 13 09:15(ET), now at $80.87, with a 7-day up of 3.44%.
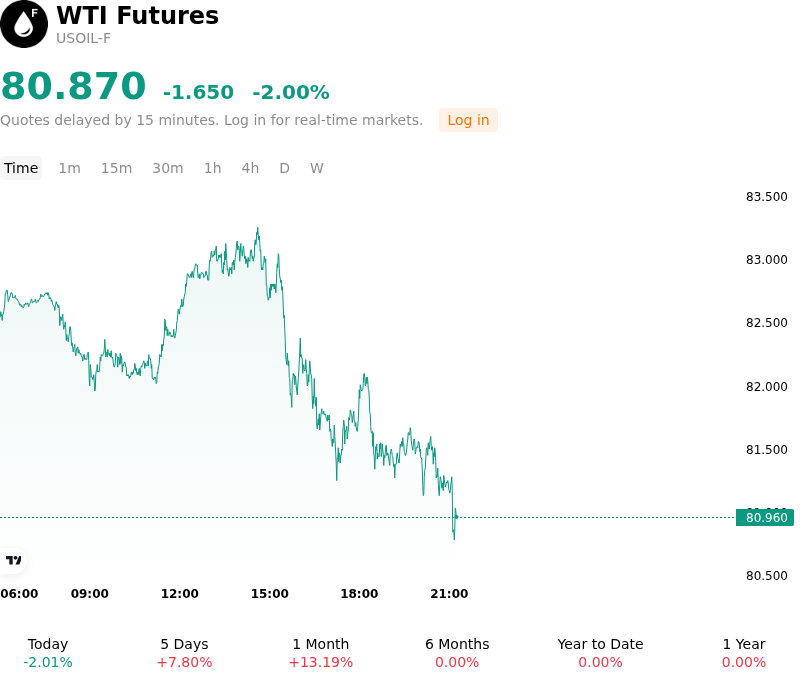
What is driving WTI Futures (USOIL-F)’s stock price down today?
The downward movement in West Texas Intermediate crude oil futures was primarily driven by a substantial and unexpected accumulation in U.S. commercial crude inventories. Data released by the U.S. Energy Information Administration revealed a sharp weekly build in domestic commercial stockpiles, contrasting with market expectations for a seasonal drawdown. A pronounced contraction in U.S. crude exports alongside elevated net import volumes contributed significantly to the domestic inventory surge, signaling near-term slack in physical crude market tightness within the Atlantic Basin.
Compounding the negative pressure from domestic inventory figures, updated monthly market reports from major energy agencies triggered a broader downward repricing of global demand expectations. Both the Organization of Petroleum Exporting Countries and the International Energy Agency lowered their projections for global oil demand growth, citing sluggish macroeconomic performance, weakening refining margins, and reduced industrial fuel consumption. The International Energy Agency highlighted that elevated energy costs and persistent trade disruptions continue to restrain global fuel consumption, leading market participants to re-evaluate structural demand projections.
While persistent geopolitical risks and regional maritime supply disruptions provided an underlying floor, market focus shifted toward immediate physical oversupply and softening consumption trends. The sharp divergence between inventory accumulation and previous tight supply expectations prompted unwinding of long positions and technical profit-taking among institutional investors. Market participants continue to monitor U.S. export flows, refinery throughput, and broader macroeconomic indicators to assess whether this repricing represents a temporary consolidation or a broader structural shift in market balance.
Technical Analysis of WTI Futures (USOIL-F)
Technically, WTI Futures (USOIL-F) shows a MACD (12,26,9) value of -0.395, indicating a neutral signal. The RSI at 50.262 suggests neutral condition and the Williams %R at 44.057 suggests buy condition. Please monitor closely.
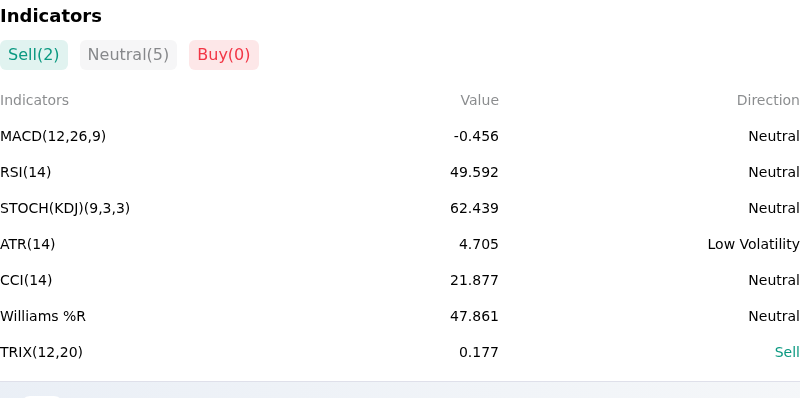
More details about WTI Futures (USOIL-F)
Recent Events and Risks:
- Massive Unexpected EIA Crude Inventory Build: U.S. commercial crude stockpiles surged by 17.4 million barrels in the latest EIA weekly report, sharply defying market expectations for a 1.4 million-barrel draw and introducing immediate physical oversupply pressure alongside a 1.6 million-barrel build at the Cushing delivery hub.
- Coordinated Global Demand Outlook Downgrades: Major energy organizations slashed their 2026 consumption forecasts in updated monthly reports, with OPEC reducing its global demand growth estimate to 580,000 barrels per day—marking its fourth consecutive downward revision—and the IEA forecasting an annual global demand contraction of 1.6 million barrels per day.
- Sluggish Refined Product Demand and Refinery Slack: Total U.S. petroleum products supplied dropped by 335,000 barrels per day while refinery utilization slipped, reinforced by weakening industrial fuel consumption and softening global diesel crack spreads.
- Physical Atlantic Basin Replenishment and Slumping Exports: Net U.S. crude imports jumped by 1.77 million barrels per day while U.S. crude exports dropped to 3.06 million barrels per day, unwinding Atlantic Basin physical market tightness and dampening geopolitical risk premiums.
Nothing in this material constitutes investment advice, personal recommendation, investment research, an offer, or a solicitation to buy or sell any financial instrument. The content has been prepared without consideration of your individual investment objectives, financial situation, or needs, and should not be treated as such.
Past performance is not a reliable indicator of future performance and/or results. Forward-looking scenarios or forecasts are not a guarantee of future performance. Actual results may differ materially from those anticipated.
Mitrade makes no representation or warranty as to the accuracy or completeness of the information provided and accepts no liability for any loss arising from reliance on such information.
Recommended Articles


