



USD/CAD (USDCAD) Is up 0.50% on Aug 24: What Is Driving the Move?
USD/CAD (USDCAD) is up 0.50% at Aug 24 03:50(ET), now at $1.38334, with a 7-day down of 0.25%.
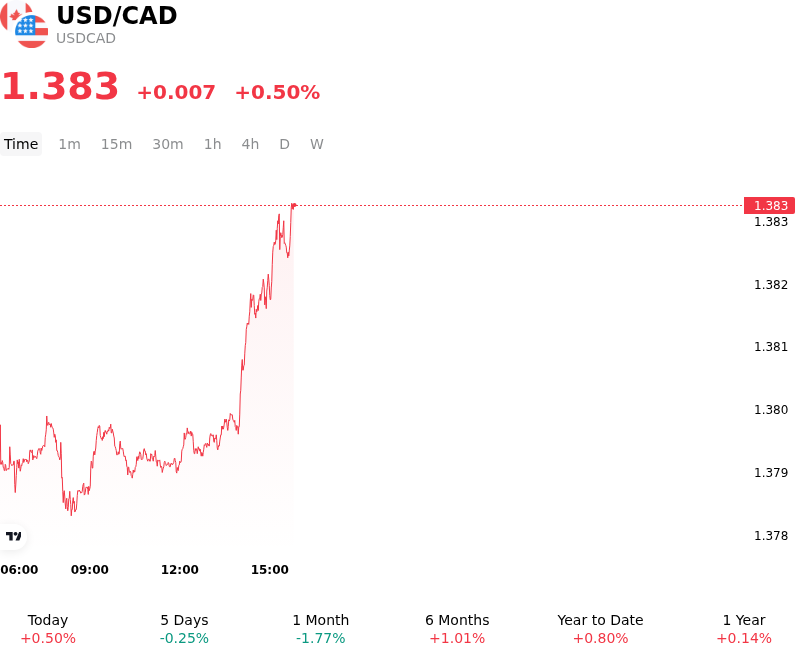
What is driving USD/CAD (USDCAD)’s stock price up today?
The advance in USDCAD was primarily driven by a sharp escalation in bilateral trade tensions between the United States and Canada. The breakdown in trade negotiations and the implementation of heavy tariffs on Canadian exports severely impaired sentiment surrounding the Canadian dollar. Because Canada's export-oriented economy relies heavily on trade access to the U.S. market, the immediate threat of trade barriers heightened downside risks to Canadian economic growth, prompting institutional investors to reduce Loonie exposure and reprice cross-border capital flows.
Diverging central bank policy expectations and interest-rate differentials further supported the pair. While the Bank of Canada has maintained a dovish-to-neutral monetary policy stance with its policy rate anchored at 2.25% amid persistent economic slack, U.S. short-term bond yields remained supported by sticky inflation dynamics and cautious expectations surrounding Federal Reserve policy. Ahead of the Jackson Hole Economic Symposium, market participants favored the U.S. dollar due to its yield advantage and the relative resilience of U.S. economic activity.
Underpinning the exchange rate movement was a broader deterioration in risk sentiment that overshadowed potential support from the energy sector. Although crude oil prices traded with a firm tone due to Middle Eastern geopolitical risks, the growth impulse for the commodity-linked currency was neutralized by protectionist headwinds. The upside move appears driven by a clear trade-policy catalyst, reinforced by a broader macroeconomic trend of widening monetary policy divergence favoring the U.S. dollar over the Canadian dollar.
Technical Analysis of USD/CAD (USDCAD)
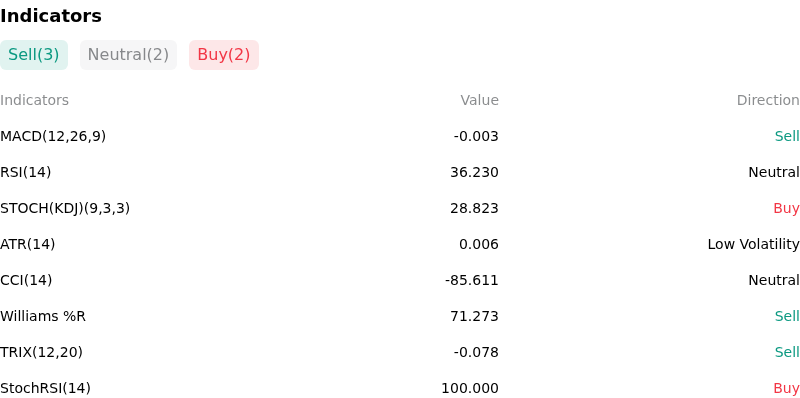
Technically, USD/CAD (USDCAD) shows a MACD (12,26,9) value of -0.003, indicating a sell signal. The RSI at 36.230 suggests neutral condition and the Williams %R at 71.273 suggests sell condition. Please monitor closely.
More details about USD/CAD (USDCAD)
Recent Events and Risks:
- Bilateral Trade and Tariff Escalation: Ongoing trade friction and the threat of elevated US tariffs on roughly $20 billion of Canadian goods—specifically impacting motor vehicles, steel, and agricultural products—create severe binary volatility risk, exposing CAD to sharp weakness if negotiations falter.
- Crude Oil Price Unwind Exposure: The Canadian dollar remains heavily reliant on elevated WTI crude oil prices driven by Middle East supply friction; any de-escalation in geopolitical tensions or sudden pullback in energy prices poses an immediate downside risk for CAD, threatening to propel USD/CAD higher.
- Monetary Policy and Yield Gap Disparity: Although headline Canadian inflation accelerated to 3.0%, tame underlying BoC core CPI metrics keep the Bank of Canada anchored at 2.25%, leaving CAD vulnerable to persistent downside pressure from the significantly higher US Federal Reserve policy rate target of 3.50%–3.75% and elevated US Treasury yields.
- Technical Squeeze Near Key Moving Average Support: USD/CAD is testing a critical support confluence near the 200-day simple moving average (1.3845–1.3870); an inability to sustain downward momentum below this floor leaves the pair highly susceptible to a bullish short-covering rally.
Nothing in this material constitutes investment advice, personal recommendation, investment research, an offer, or a solicitation to buy or sell any financial instrument. The content has been prepared without consideration of your individual investment objectives, financial situation, or needs, and should not be treated as such.
Past performance is not a reliable indicator of future performance and/or results. Forward-looking scenarios or forecasts are not a guarantee of future performance. Actual results may differ materially from those anticipated.
Mitrade makes no representation or warranty as to the accuracy or completeness of the information provided and accepts no liability for any loss arising from reliance on such information.
Recommended Articles


