



Robinhood Markets Inc Stock (HOOD) Moved Up by 15.30% on Sep 3: Key Drivers Unveiled
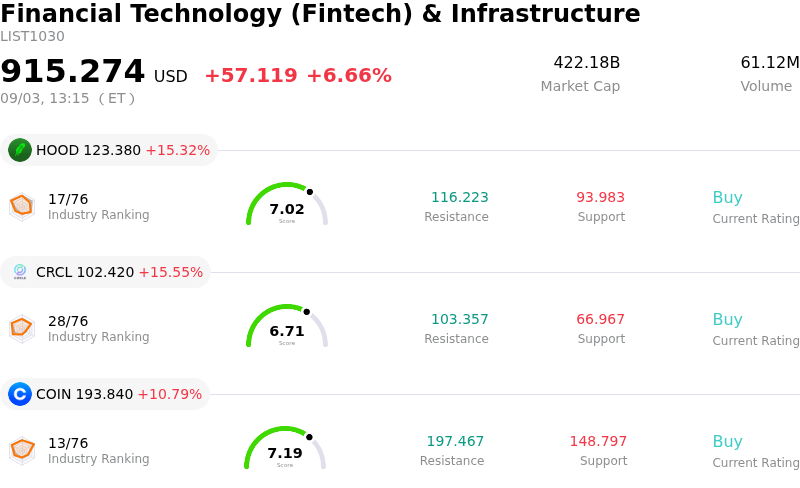
Robinhood Markets Inc (HOOD) moved up by 15.30%. The Financial Technology (Fintech) & Infrastructure sector is up by 6.66%. The company outperformed the industry. Top 3 stocks by turnover in the sector: Robinhood Markets Inc (HOOD) up 15.32%; Circle Internet Group Inc (CRCL) up 15.55%; Coinbase Global Inc (COIN) up 10.79%.
What is driving Robinhood Markets Inc (HOOD)’s stock price up today?
Robinhood Markets experienced a powerful rally driven by a convergence of positive Wall Street analyst re-evaluations and landmark operational milestones across its expanding fintech ecosystem. Institutional sentiment shifted decisively higher as major research firms issued consecutive upgrades and price target increases, reinforcing the market narrative that the company is successfully transforming from a traditional, market-sensitive retail brokerage into a diversified financial services powerhouse.
A primary catalyst for the upward momentum was a flurry of bullish research notes from leading Wall Street institutions. Morgan Stanley upgraded the company to an Overweight rating while significantly raising its price target, highlighting rapid growth in customer assets and expanding revenue streams per user. Scotiabank initiated coverage with an Outperform rating, arguing that Robinhood's multi-faceted revenue structure—spanning trading, net interest income, subscriptions, clearing services, and digital asset infrastructure—is increasingly resilient and less tied to cyclical retail equity trading. Additionally, Piper Sandler boosted its price target, citing near-term volume catalysts in the company's prediction-market business.
Compounding the institutional enthusiasm was news highlighting the performance of the platform's proprietary Layer-2 blockchain network, Robinhood Chain. Industry analytics revealed that the network generated record daily fee revenue and processed millions of transactions, capturing a dominant share of global on-chain activity. This milestone validated the company's strategic push into decentralized infrastructure and tokenized asset movement, offering concrete proof that its technology investments are yielding high-margin, scalable revenue outside conventional brokerage operations.
Investors also drew confidence from the broader fundamental backdrop, anchored by strong quarterly financial metrics including record revenues, expanding active customer accounts, and substantial net deposit growth. With event-based contracts and subscription tiers scaling rapidly alongside core trading, Robinhood is demonstrating enhanced monetization per user. Although elevated valuation multiples require sustained operational execution, the strong market reaction reflects growing conviction among institutional investors that the company's expanding platform economics provide durable long-term growth.
Technical Analysis of Robinhood Markets Inc (HOOD)
Technically, Robinhood Markets Inc (HOOD) shows a MACD (12,26,9) value of 3.388, indicating a buy signal. The RSI at 68.127 suggests neutral condition and the Williams %R at 2.684 suggests overbought condition. Please monitor closely.
Media Coverage of Robinhood Markets Inc (HOOD)
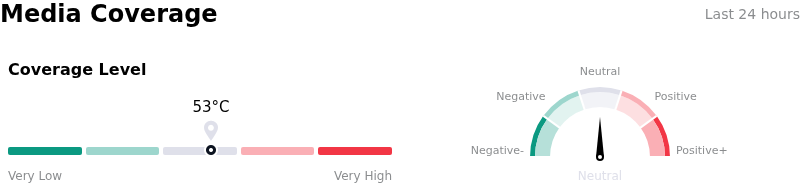
In terms of media coverage, Robinhood Markets Inc (HOOD) shows a coverage score of 53, indicating a moderate level of media attention. The overall market sentiment index is currently in neutral zone.
Fundamental Analysis of Robinhood Markets Inc (HOOD)
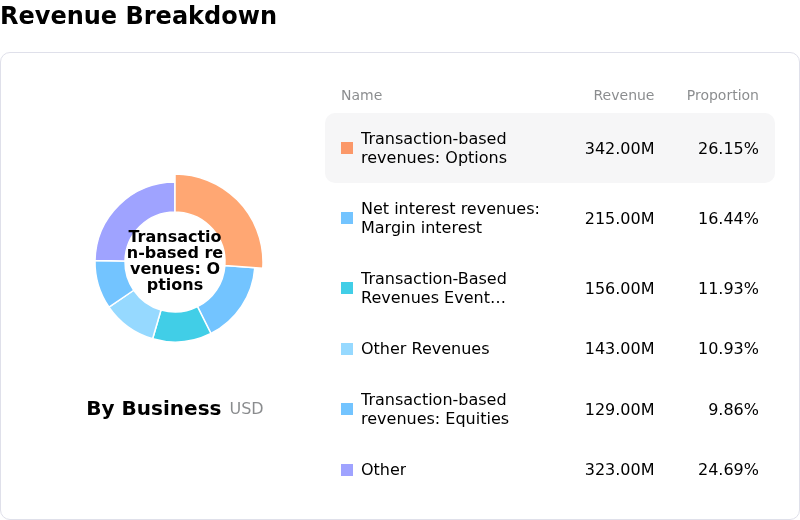
Robinhood Markets Inc (HOOD) is in the Financial Technology (Fintech) & Infrastructure industry. Its latest annual revenue is $4.47B, ranking 8 in the industry. The net profit is $1.88B, ranking 4 in the industry. Company Profile
Over the past month, multiple analysts have rated the company as Buy, with an average price target of $124.22, a high of $163.00, and a low of $55.04.
More details about Robinhood Markets Inc (HOOD)
Company Specific Risks:
- Elevated Valuation Metrics and Pullback Risk: Following recent intraday surges, market valuation metrics indicate HOOD is trading at a steep 37% to 57% premium over its estimated intrinsic fair value of $78.14–$78.18, with a TTM P/E ratio above 47x–54x that leaves the stock highly vulnerable to sharp downside corrections.
- Persistent Insider Net Selling Activity: SEC Form 4 disclosures and market data highlight continuous net insider selling—totaling tens of millions over the past quarter and over $1 billion in the past year—signaling a lack of executive buying conviction at current valuation levels.
- Transaction Revenue Concentration and Rate-Cut Exposure: Institutional analysts caution that earnings remain heavily dependent on cyclical retail trading velocity, while prospective Federal Reserve interest rate cuts pose a direct threat to net interest income derived from customer cash-sweep balances.
- Over-Reliance on Volatile Crypto and Speculative Trading: Intraday volatility demonstrates a tight correlation with crypto market sentiment and speculative event contracts, leaving top-line growth exposed to sharp drops in digital asset trading volumes and regulatory shifts in prediction markets.
Nothing in this material constitutes investment advice, personal recommendation, investment research, an offer, or a solicitation to buy or sell any financial instrument. The content has been prepared without consideration of your individual investment objectives, financial situation, or needs, and should not be treated as such.
Past performance is not a reliable indicator of future performance and/or results. Forward-looking scenarios or forecasts are not a guarantee of future performance. Actual results may differ materially from those anticipated.
Mitrade makes no representation or warranty as to the accuracy or completeness of the information provided and accepts no liability for any loss arising from reliance on such information.
Recommended Articles


