



Celestica Inc Stock (CLS) Moved Up by 11.74% on Sep 3: Facts Behind the Movement
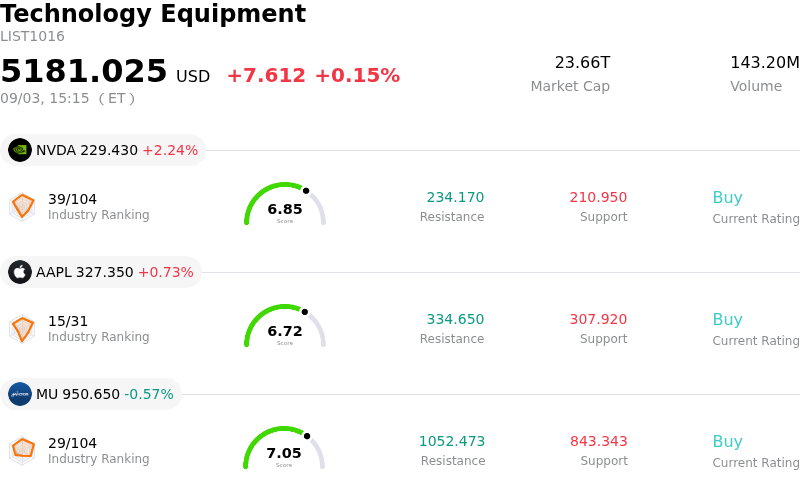
Celestica Inc (CLS) moved up by 11.74%. The Technology Equipment sector is up by 0.15%. The company outperformed the industry. Top 3 stocks by turnover in the sector: NVIDIA Corp (NVDA) up 2.21%; Apple Inc (AAPL) up 0.73%; Micron Technology Inc (MU) down 0.59%.
What is driving Celestica Inc (CLS)’s stock price up today?
Celestica experienced a sharp upward surge as investor sentiment turned decidedly bullish following a period of post-offering consolidation. The stock mounted a strong technical rebound off key support levels after market participants digested the impact of its major capital raise completed earlier in the quarter. Dip-buying activity intensified as concerns over short-term equity dilution receded, allowing investors to refocus on the company's robust earnings trajectory and accelerating operational fundamentals.
The primary catalyst driving the rally remains the robust demand for artificial intelligence data center infrastructure and advanced networking hardware. Within Celestica's Connectivity and Cloud Solutions segment, hyperscaler capital expenditure continues to fuel rapid expansion in high-performance AI compute programs and enterprise hardware. Investors responded favorably to the firm's execution in scaling production for next-generation 1.6T switching platforms, alongside expanding design partnerships with major semiconductor and cloud technology providers for custom AI accelerator racks.
Favorable analyst commentary and positive earnings estimate revisions further amplified buying interest during the trading session. Institutional investors favored the company's raised annual guidance, record operating margins, and strong multi-year revenue visibility extending into 2027. Although high working capital requirements and customer concentration remain ongoing operational factors to monitor, the renewed buying pressure and positive market momentum carried the stock significantly higher.
Technical Analysis of Celestica Inc (CLS)
Technically, Celestica Inc (CLS) shows a MACD (12,26,9) value of -1.051, indicating a sell signal. The RSI at 48.669 suggests neutral condition and the Williams %R at 49.669 suggests neutral condition. Please monitor closely.
Fundamental Analysis of Celestica Inc (CLS)
Celestica Inc (CLS) is in the Technology Equipment industry. Its latest annual revenue is $12.39B, ranking 8 in the industry. The net profit is $832.50M, ranking 7 in the industry. Company Profile
Over the past month, multiple analysts have rated the company as Buy, with an average price target of $450.95, a high of $535.00, and a low of $305.00.
More details about Celestica Inc (CLS)
Company Specific Risks:
- Dilutive Equity Raise Overhang: Market reaction to Celestica's recent $3 billion equity offering completed in August 2026 continues to generate downside pressure, as roughly 9% equity dilution resets per-share valuation expectations and sparks ongoing technical profit-taking.
- Elevated Valuation Premium and Sector Vulnerability: Trading at a trailing P/E ratio of 28.8x compared to its five-year median of 17.3x, Celestica remains acutely exposed to multiple compression during broader technology sector drawdowns and AI valuation reassessments.
- Significant Executive Insider Liquidation: SEC filings revealing over $135 million in insider stock sales over recent months—including major equity divestments by CEO Robert Mionis and CFO Mandeep Chawla—have heightened institutional caution regarding internal sentiment at elevated share prices.
- Working Capital Strain and Cash Conversion Risk: Rapid operational scaling to manufacture next-generation 1.6T hyperscaler compute platforms requires heavy working capital commitments and elevated capital expenditures, creating friction in converting top-line revenue growth into durable free cash flow.
Nothing in this material constitutes investment advice, personal recommendation, investment research, an offer, or a solicitation to buy or sell any financial instrument. The content has been prepared without consideration of your individual investment objectives, financial situation, or needs, and should not be treated as such.
Past performance is not a reliable indicator of future performance and/or results. Forward-looking scenarios or forecasts are not a guarantee of future performance. Actual results may differ materially from those anticipated.
Mitrade makes no representation or warranty as to the accuracy or completeness of the information provided and accepts no liability for any loss arising from reliance on such information.
Recommended Articles


