



General Motors Co Stock (GM) Moved Down by 5.32% on Sep 18: What Investors Need To Know
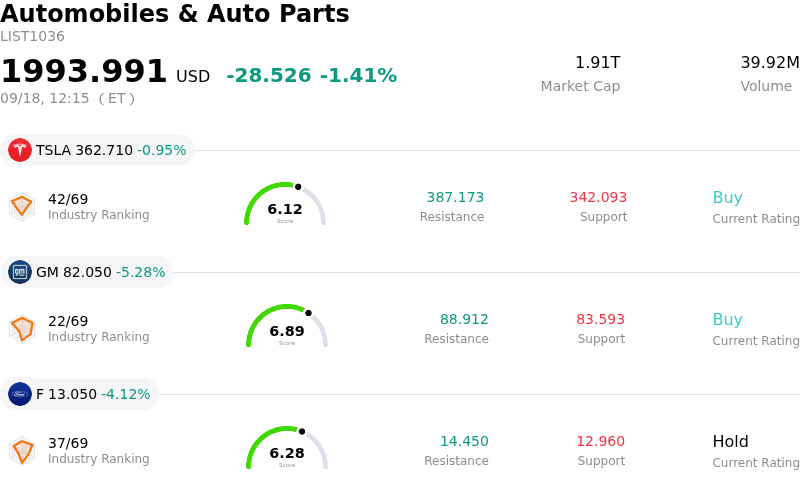
General Motors Co (GM) moved down by 5.32%. The Automobiles & Auto Parts sector is down by 1.41%. The company underperformed the industry. Top 3 stocks by turnover in the sector: Tesla Inc (TSLA) down 0.95%; General Motors Co (GM) down 5.28%; Ford Motor Co (F) down 4.15%.
What is driving General Motors Co (GM)’s stock price down today?
General Motors experienced a sharp downturn as market sentiment shifted away from consumer discretionary and auto stocks following a short-lived rotation rally. Broader macroeconomic caution and an unwinding of cyclical trades placed widespread pressure on the automotive sector, with institutional investors reallocating capital away from traditional original equipment manufacturers. The selling pressure across auto manufacturers outpaced the broader market, reflecting investor hesitancy toward near-term consumer spending durability and prospective demand softness in the final quarter of the year.
Compounding the negative sector momentum, investors remain sensitive to operational and regulatory risks facing the automaker. Recent safety investigations by highway safety regulators concerning engine reliability across high-volume full-size trucks and SUVs, alongside vehicle recalls over equipment issues, have raised potential warranty and repair cost concerns. Furthermore, while General Motors continues to manage significant capital expenditures for its electric vehicle transition and battery manufacturing footprint, lingering uncertainty regarding electric vehicle adoption rates and margin headwinds keeps market participants cautious about near-term cash flow.
Despite the immediate weakness, General Motors' underlying strategic initiatives continue to build a foundation for long-term margin expansion. Operational progress, such as delivering defense components for Patriot interceptor missiles in partnership with Lockheed Martin, highlights an emerging, higher-margin revenue stream designed to reduce overall business cyclicality. Additionally, refined software strategies—such as restoring popular smartphone integration features on upcoming truck lines and expanding recurring subscription offerings like Super Cruise and OnStar—support analyst projections for recurring revenue growth. However, in the immediate term, macro-driven sector liquidation and regulatory scrutiny overwhelmed these structural positives, driving intraday volatility and downward pressure on the stock.
Technical Analysis of General Motors Co (GM)
Technically, General Motors Co (GM) shows a MACD (12,26,9) value of -0.733, indicating a neutral signal. The RSI at 41.838 suggests neutral condition and the Williams %R at 94.404 suggests oversold condition. Please monitor closely.
Media Coverage of General Motors Co (GM)
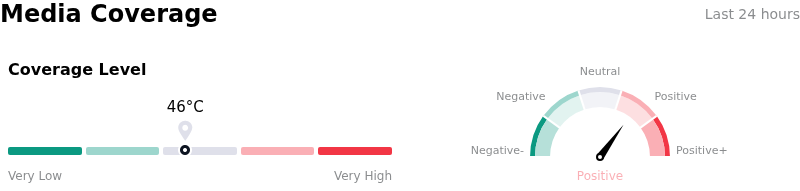
In terms of media coverage, General Motors Co (GM) shows a coverage score of 46, indicating a moderate level of media attention. The overall market sentiment index is currently in bullish zone.
Fundamental Analysis of General Motors Co (GM)
General Motors Co (GM) is in the Automobiles & Auto Parts industry. Its latest annual revenue is $185.02B, ranking 3 in the industry. The net profit is $3.18B, ranking 3 in the industry. Company Profile
Over the past month, multiple analysts have rated the company as Buy, with an average price target of $101.87, a high of $132.00, and a low of $71.00.
More details about General Motors Co (GM)
Company Specific Risks:
- Production Transition and Delivery Shortfall: Management announced that transitioning assembly lines for next-generation pickup trucks is projected to reduce fourth-quarter deliveries by approximately 35,000 units, directly impacting volume and cash flow in the company's core North American profit segment.
- Electric Vehicle Profitability Headwinds: Corporate leadership flagged persistent margin drag in the electric vehicle unit stemming from tariffs and regulatory credit constraints, delaying profitability timelines for its EV portfolio amid heavy capital expenditure requirements.
- Warranty Expenses and Safety Recalls: Escalating product reliability concerns—including a safety recall affecting roughly 300,000 SUVs due to rearview camera failures alongside powertrain service bulletins—threaten to elevate warranty expenses and compress net operating margins.
- Valuation Strain and Capital Outflows: Institutional commentary emphasizes compressed net margins and elevated valuation multiples, which have coincided with significant insider share liquidations exceeding $200 million over the past year, limiting short-term upside.
Nothing in this material constitutes investment advice, personal recommendation, investment research, an offer, or a solicitation to buy or sell any financial instrument. The content has been prepared without consideration of your individual investment objectives, financial situation, or needs, and should not be treated as such.
Past performance is not a reliable indicator of future performance and/or results. Forward-looking scenarios or forecasts are not a guarantee of future performance. Actual results may differ materially from those anticipated.
Mitrade makes no representation or warranty as to the accuracy or completeness of the information provided and accepts no liability for any loss arising from reliance on such information.
Recommended Articles


