



British Pound gives back UK sales pop as Oil shock returns
- GBP/USD surrenders gains despite stronger-than-expected UK Retail Sales.
- Saudi supply concerns revive inflation risks across global markets.
- Fed-BoE rate differential keeps broader pressure tilted toward Sterling.
The Pound Sterling retraces after reaching a daily high of 1.3375 on upbeat UK data, as headlines suggest that an oil supply shock has sent crude prices higher and reignited investors' fears of high inflation. The GBP/USD trades at 1.3356, down 0.03%.
Sterling fades as renewed energy fears overshadow resilient UK consumer spending
Recently, a Bloomberg article titled “Saudis give European Oil buyers no supplies for next month” is an indication that Oil prices are poised to remain elevated, despite registering losses in the day, with West Texas Intermediate (WTI) trading at $97.34, down 3.80%.
Data from the US revealed that Industrial Production was unchanged from July to August, at 0% MoM, below July’s 0.2% print and missing estimates for a 0.3% expansion.
The report comes after Fed Chair Kevin Warsh noted that the economy remains resilient, justifying the US central bank's decision on Wednesday to raise rates by 25 basis points to the 3.75%-4% range.
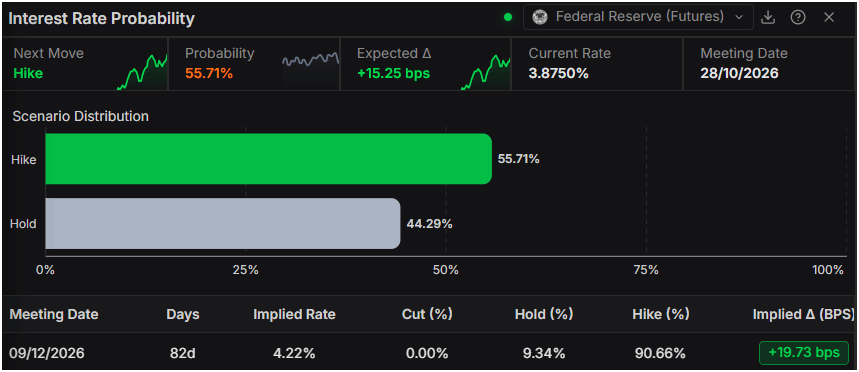
Following the Fed’s decision, money markets seem confident that the Fed could hike once more in October, with the odds standing at 55%, according to Prime Terminal.
In the meantime, Sterling’s was boosted by the jump of UK Retail Sales of 0.5% MoM in August, exceeding estimates for a -0.2% contraction. The data revealed that consumer spending remains solid. The data can prompt the Bank of England (BoE) to act and raise rates, given the UK’s status as a net energy importer, as the bank acknowledged that inflation risks are tilted to the upside, in part due to the US-Iran conflict.
Money market traders currently assign about a 65% likelihood of a rate hike in November and expect approximately four 25-basis-point increases by the end of next year.
Despite this, the interest rate differential between the US and the UK favors the Greenback, as it has widened after both central banks' September meetings.
GBP/USD Price Forecast: Technical outlook
In the daily chart, GBP/USD trades at 1.3363, maintaining a bearish near-term bias as spot holds beneath the clustered 50-, 100- and 200-day simple moving averages (SMAs) around 1.3481 and under the descending trend-line resistance coming in near 1.3455. The latest reading of the 14-day Relative Strength Index at 31.9 sits just above oversold territory, hinting that while selling pressure dominates, the downside could begin to lose momentum if bears fail to extend the move much below the recent lows.
On the downside, immediate structural support is located at the prior descending trend-line break around 1.3345, which now acts as a nearby floor and would be at risk on a fresh push lower. On the topside, initial resistance is seen at the downward-sloping trend line near 1.3455, followed by the dense SMA cluster around 1.3481 and the broken rising trend lines at 1.3488 and 1.3701, levels that would need to be decisively reclaimed to shift the broader technical tone away from the current bearish configuration.
(The technical analysis of this story was written with the help of an AI tool. Know more.)
US Dollar Price This week
The table below shows the percentage change of US Dollar (USD) against listed major currencies this week. US Dollar was the strongest against the Japanese Yen.
| USD | EUR | GBP | JPY | CAD | AUD | NZD | CHF | |
|---|---|---|---|---|---|---|---|---|
| USD | 1.15% | 1.17% | 2.26% | 1.01% | 0.77% | 1.84% | 0.89% | |
| EUR | -1.15% | 0.00% | 1.10% | -0.14% | -0.38% | 0.69% | -0.26% | |
| GBP | -1.17% | -0.00% | 1.09% | -0.14% | -0.38% | 0.69% | -0.29% | |
| JPY | -2.26% | -1.10% | -1.09% | -1.25% | -1.51% | -0.49% | -1.42% | |
| CAD | -1.01% | 0.14% | 0.14% | 1.25% | -0.21% | 0.82% | -0.16% | |
| AUD | -0.77% | 0.38% | 0.38% | 1.51% | 0.21% | 1.07% | 0.11% | |
| NZD | -1.84% | -0.69% | -0.69% | 0.49% | -0.82% | -1.07% | -0.97% | |
| CHF | -0.89% | 0.26% | 0.29% | 1.42% | 0.16% | -0.11% | 0.97% |
The heat map shows percentage changes of major currencies against each other. The base currency is picked from the left column, while the quote currency is picked from the top row. For example, if you pick the US Dollar from the left column and move along the horizontal line to the Japanese Yen, the percentage change displayed in the box will represent USD (base)/JPY (quote).
Nothing in this material constitutes investment advice, personal recommendation, investment research, an offer, or a solicitation to buy or sell any financial instrument. The content has been prepared without consideration of your individual investment objectives, financial situation, or needs, and should not be treated as such.
Past performance is not a reliable indicator of future performance and/or results. Forward-looking scenarios or forecasts are not a guarantee of future performance. Actual results may differ materially from those anticipated.
Mitrade makes no representation or warranty as to the accuracy or completeness of the information provided and accepts no liability for any loss arising from reliance on such information.
Recommended Articles


