



LPL Financial Holdings Inc Stock (LPLA) Moved Down by 7.18% on Sep 22: Facts Behind the Movement
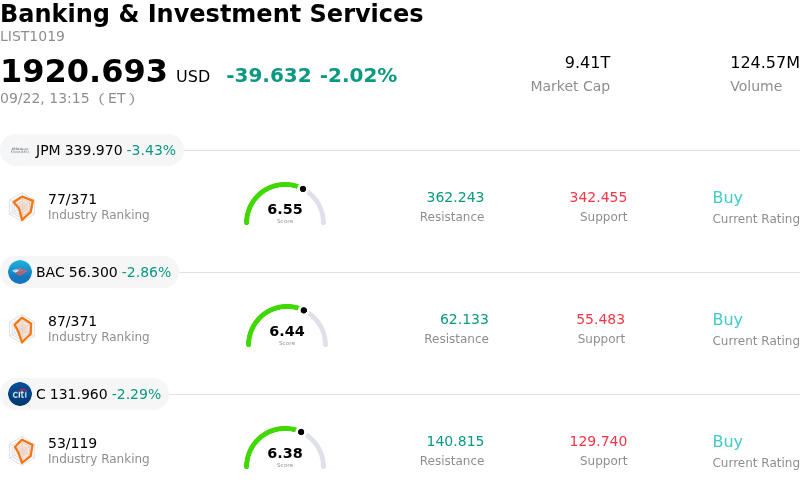
LPL Financial Holdings Inc (LPLA) moved down by 7.18%. The Banking & Investment Services sector is down by 2.02%. The company underperformed the industry. Top 3 stocks by turnover in the sector: JPMorgan Chase & Co (JPM) down 3.42%; Bank of America Corp (BAC) down 2.86%; Citigroup Inc (C) down 2.29%.
What is driving LPL Financial Holdings Inc (LPLA)’s stock price down today?
LPL Financial Holdings experienced notable downward pressure during today's trading session, largely driven by broader risk-off sentiment across the independent wealth management and capital markets sector. Market participants are increasingly focused on headwinds surrounding interest-rate-sensitive revenue channels, particularly cash sweep account yields. As expectations for monetary easing and interest rate adjustments evolve, concerns regarding potential compression in cash sweep margins and net interest income have weighed on investor enthusiasm for broker-dealer platforms.
Compounding the negative momentum are technical sell signals and recent insider trading disclosures. Technical breakdowns below key short-term moving averages triggered programmatic selling and stop-loss executions, accelerating the stock's intraday decline. Additionally, periodic insider stock sales disclosed in recent regulatory filings, while routine, contributed to a cautious tone among traders. Investors also remain attentive to industry-wide scrutiny regarding client cash compensation practices, which continues to create short-term valuation overhangs for independent broker-dealers.
Despite the sell-off, LPL Financial's underlying strategic position remains supported by consistent organic advisor recruitment and steady expansion in total client assets under management. The firm's long-term narrative continues to hinge on its scale advantage and ability to transition financial advisors onto its platform. However, near-term stock trajectory will likely stay tied to interest rate policy shifts, net interest revenue guidance, and broader equity market volatility.
Technical Analysis of LPL Financial Holdings Inc (LPLA)
Technically, LPL Financial Holdings Inc (LPLA) shows a MACD (12,26,9) value of -9.752, indicating a sell signal. The RSI at 26.754 suggests sell condition and the Williams %R at 88.220 suggests oversold condition. Please monitor closely.
Fundamental Analysis of LPL Financial Holdings Inc (LPLA)
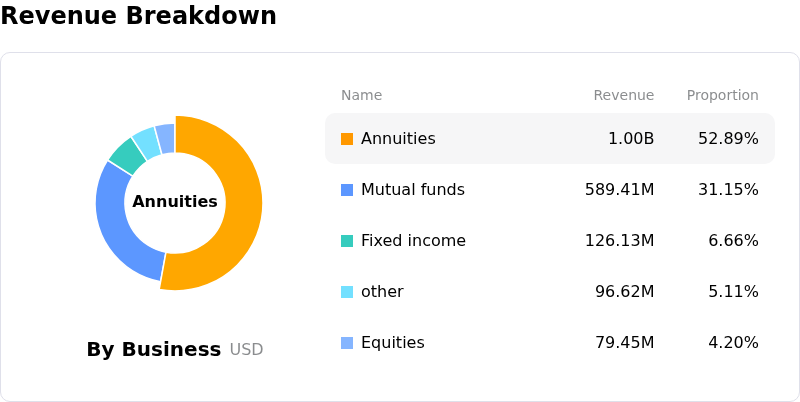
LPL Financial Holdings Inc (LPLA) is in the Banking & Investment Services industry. Its latest annual revenue is $16.81B, ranking 14 in the industry. The net profit is $863.02M, ranking 25 in the industry. Company Profile
Over the past month, multiple analysts have rated the company as Buy, with an average price target of $430.61, a high of $557.00, and a low of $377.00.
More details about LPL Financial Holdings Inc (LPLA)
Company Specific Risks:
- Technical Breakdown and Downward Price Momentum: LPLA shares broke below key technical support levels near $333, accelerating intraday downside volatility and extending a multi-day sell-off driven by heightened institutional selling pressure.
- Key Advisor Attrition and Competitive Poaching: The recent departure of major advisory practices, including the $2.1 billion Sierra Ridge Advisor Group to competitor Cetera, underscores intensifying competition for high-producing advisor retention, directly threatening assets under administration (AUA) and recurring fee revenues.
- Legal and Regulatory Liabilities in Product Oversight and Cash Management: Ongoing client class-action lawsuits regarding cash sweep yield spreads and alleged supervision failures on legacy variable annuity products maintain persistent litigation risk and potential compliance cost exposure.
- Interest Rate Sensitivity and Cash Sweep Revenue Exposure: LPLA remains highly dependent on interest-rate-sensitive deposit and cash sweep yields, leaving profitability exposed to net interest margin compression in lower rate environments or as clients move cash into higher-yielding money market alternatives.
Nothing in this material constitutes investment advice, personal recommendation, investment research, an offer, or a solicitation to buy or sell any financial instrument. The content has been prepared without consideration of your individual investment objectives, financial situation, or needs, and should not be treated as such.
Past performance is not a reliable indicator of future performance and/or results. Forward-looking scenarios or forecasts are not a guarantee of future performance. Actual results may differ materially from those anticipated.
Mitrade makes no representation or warranty as to the accuracy or completeness of the information provided and accepts no liability for any loss arising from reliance on such information.
Recommended Articles


