



Johnson & Johnson Stock (JNJ) Opened Down by 3.91% on Oct 13: Facts Behind the Movement
Johnson & Johnson (JNJ) opened down by 3.91%. The Pharmaceuticals & Medical Research sector is down by 0.87%. The company underperformed the industry. Top 3 stocks by turnover in the sector: Johnson & Johnson (JNJ) down 3.91%; AbbVie Inc (ABBV) down 0.71%; Moderna Inc (MRNA) down 0.44%.
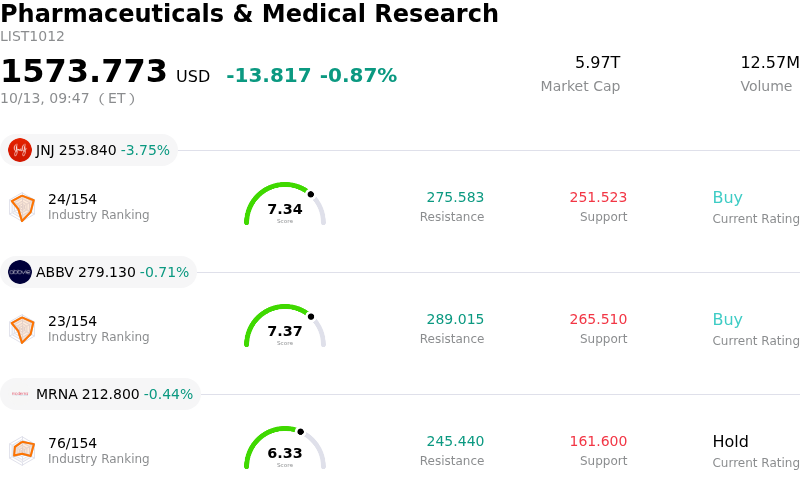
What is driving Johnson & Johnson (JNJ)’s stock price down today?
Johnson & Johnson experienced downward pressure following the release of its third-quarter financial results. Although top-line revenue surpassed consensus expectations, the market responded negatively to an adjusted earnings per share miss. Investors focused on operational drag within key segments, which overshadowed management's modest upward adjustment to full-year guidance.
A key driver of the decline was weakness in the MedTech division, where international sales growth stagnated. Management noted that geopolitical tensions in the Middle East, government austerity in Europe, and persistent pricing pressure in China impacted device demand. Furthermore, performance in the Innovative Medicine segment presented a mixed picture; despite solid growth in key immunology therapies, sales of major oncology treatments fell short of Wall Street estimates. Heavy GAAP charges related to legal settlements for talc litigation and business acquisition expenses also created headwind for reported earnings.
Market sentiment was further affected by valuation considerations and profit-taking following a substantial year-to-date advance. Trading at elevated valuation multiples prior to the print, the stock left little room for operational misses. The combination of segment-level revenue softness and lingering legal liability costs prompted institutional investors to recalibrate expectations, driving elevated volume and intraday volatility.
Technical Analysis of Johnson & Johnson (JNJ)
Technically, Johnson & Johnson (JNJ) shows a MACD (12,26,9) value of -1.605, indicating a sell signal. The RSI at 38.570 suggests neutral condition and the Williams %R at 89.651 suggests oversold condition. Please monitor closely.
Media Coverage of Johnson & Johnson (JNJ)
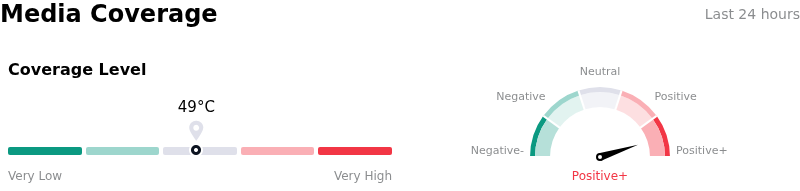
In terms of media coverage, Johnson & Johnson (JNJ) shows a coverage score of 49, indicating a moderate level of media attention. The overall market sentiment index is currently in extremely bullish zone.
Fundamental Analysis of Johnson & Johnson (JNJ)
Johnson & Johnson (JNJ) is in the Pharmaceuticals & Medical Research industry. Its latest annual revenue is $94.19B, ranking 3 in the industry. The net profit is $26.80B, ranking 1 in the industry. Company Profile
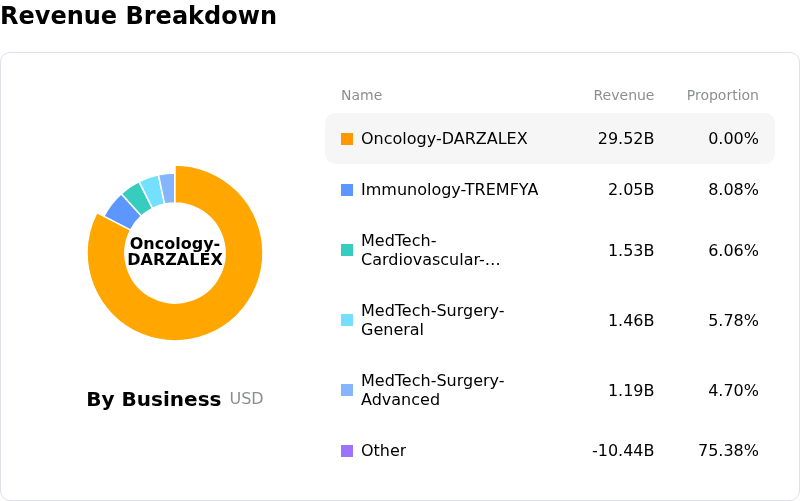
Over the past month, multiple analysts have rated the company as Buy, with an average price target of $275.26, a high of $320.00, and a low of $170.00.
More details about Johnson & Johnson (JNJ)
Company Specific Risks:
- Litigation Charges & GAAP Profit Collapse: In its Q3 2026 earnings release and Form 8-K filed on October 13, 2026, GAAP net earnings dropped 96% year-over-year to $210 million ($0.09 per share) due to a $5.5 billion pre-tax legal charge for proposed talc litigation settlements, leaving significant legal uncertainty regarding final claimant approval and future cash outflows starting in 2027.
- Stelara Patent Loss & Portfolio Erosion: Third-quarter 2026 results highlighted accelerating revenue drag from biosimilar competition on key immunology blockbuster Stelara, which created an approximate 690 basis points headwinds on Innovative Medicine operational sales alongside revenue declines in Simponi and Remicade.
- MedTech Sluggishness & Electrophysiology Competition: MedTech operational growth decelerated to just 2.5% year-over-year in Q3 2026, lagging pharmaceutical performance as sell-side analysts highlighted growing competitive pressure in electrophysiology and ongoing international geopolitical friction.
- Heavy Insider Offloading & Institutional Trimming: Ownership updates trailing the Q3 release reveal net insider sales reaching $154.9 million over the past 12 months, accompanied by nearly three times as many institutional guru funds trimming JNJ holdings as those adding positions.
Nothing in this material constitutes investment advice, personal recommendation, investment research, an offer, or a solicitation to buy or sell any financial instrument. The content has been prepared without consideration of your individual investment objectives, financial situation, or needs, and should not be treated as such.
Past performance is not a reliable indicator of future performance and/or results. Forward-looking scenarios or forecasts are not a guarantee of future performance. Actual results may differ materially from those anticipated.
Mitrade makes no representation or warranty as to the accuracy or completeness of the information provided and accepts no liability for any loss arising from reliance on such information.
Recommended Articles


