



Brent (UKOIL) Moved Sharply on Oct 30: Inventories, the Dollar, or Geopolitics?
Brent (UKOIL) is up 2.10% at Oct 30 21:55(ET), now at $113.37, with a 7-day up of 1.60%.
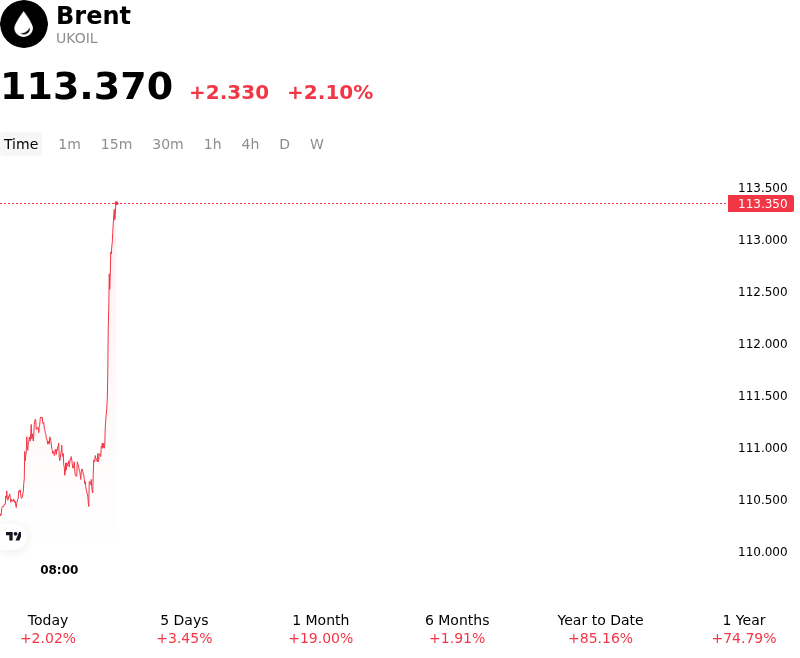
What is driving Brent (UKOIL)’s stock price up today?
The upward momentum in Brent crude oil was primarily driven by heightened supply security risks in the Middle East and tight physical market conditions. Escalating geopolitical friction, including reports surrounding potential military actions targeting Iranian energy infrastructure and threats directed at major Saudi processing facilities, reinforced fears of acute regional supply disruptions. These developments coincided with noticeable declines in crude shipments originating from the Gulf of Oman, prompting institutional investors to re-inject a substantial geopolitical risk premium into nearby futures contracts.
Fundamental balances provided additional structural support as commercial inventory levels remained uncomfortably low. Weekly petroleum status reports highlighted a drawdown in U.S. crude stockpiles alongside lower inventories at primary storage hubs, defying expectations of a seasonal inventory build. Major energy producers also emphasized that low global stockpiles are sustaining elevated price levels, underscoring that physical supply tightness is providing fundamental backing to spot markets. Furthermore, market expectations that OPEC+ will maintain a disciplined production posture at its upcoming meeting reinforced a constrained global supply outlook.
Trading dynamics and liquidity conditions further amplified intraday price action. Contract expiration effects and active position rolling into deferred delivery months created technical momentum, forcing systematic funds and algorithmic traders to cover short exposures. With the forward curve remaining firmly in backwardation and middle distillate inventories remaining restricted globally, market participants prioritized upside protection against potential supply shocks, sustaining upward pressure on the international benchmark.
Technical Analysis of Brent (UKOIL)
Technically, Brent (UKOIL) shows a MACD (12,26,9) value of 0.662, indicating a buy signal. The RSI at 69.957 suggests neutral condition and the Williams %R at 1.272 suggests overbought condition. Please monitor closely.
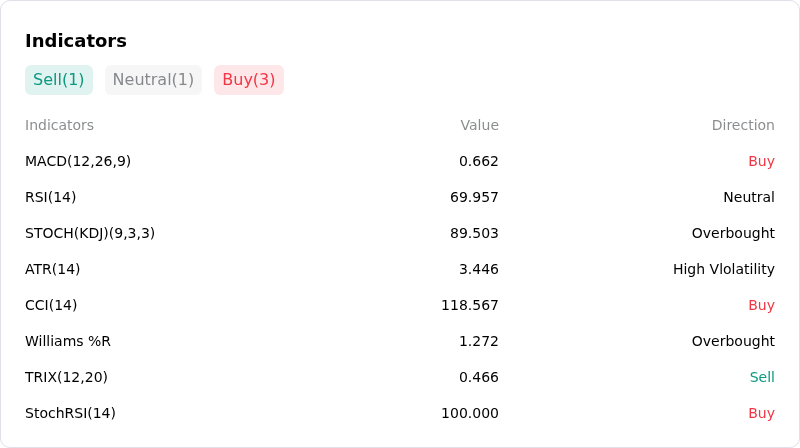
More details about Brent (UKOIL)
Recent Events and Risks:
- Geopolitical Risk Premium Cooling and Speculative Unwind: Emerging diplomatic signals and renewed international contacts have softened acute supply disruption fears, prompting institutional investors to unwind embedded geopolitical risk premiums and lock in gains on speculative long positions.
- Sluggish Global Demand and Macroeconomic Headwinds: Persistent elevated interest rates, inflation pressure, and slowing global industrial activity—compounded by cautious purchasing from Chinese refiners—continue to weigh heavily on medium-term consumption growth forecasts.
- Physical Supply Restoration and Easing Transit Constraints: The gradual return of previously shut-in crude production alongside recovering maritime shipping flows through key transit routes has increased prompt seaborne availability and compressed prompt spot spreads.
- Technical Resistance Rejection and Algorithmic Liquidation: Intraday price failures to breach major overhead resistance thresholds triggered momentum indicator breakdowns, stop-loss orders, and systematic algorithmic selling toward lower support levels.
Nothing in this material constitutes investment advice, personal recommendation, investment research, an offer, or a solicitation to buy or sell any financial instrument. The content has been prepared without consideration of your individual investment objectives, financial situation, or needs, and should not be treated as such.
Past performance is not a reliable indicator of future performance and/or results. Forward-looking scenarios or forecasts are not a guarantee of future performance. Actual results may differ materially from those anticipated.
Mitrade makes no representation or warranty as to the accuracy or completeness of the information provided and accepts no liability for any loss arising from reliance on such information.
Recommended Articles


