

USD/CHF Price Forecast: Bullish momentum builds as the pair challenges the 200-day SMA
- USD/CHF extends gains for a third straight day as broad-based US Dollar strength persists.
- SNB intervention concerns limit CHF safe-haven appeal despite risk-off backdrop.
- Technically, the pair tests the 200-day SMA after clearing key resistance and shorter-term averages.
USD/CHF extends gains on Thursday as broad-based US Dollar (USD) strength persists amid rising Middle East tensions, while the Swiss Franc (CHF) struggles to gain traction as traders remain cautious about potential intervention from the Swiss National Bank to curb excessive currency appreciation.
At the time of writing, USD/CHF is trading around 0.7941, remaining on the front foot for a third consecutive day.
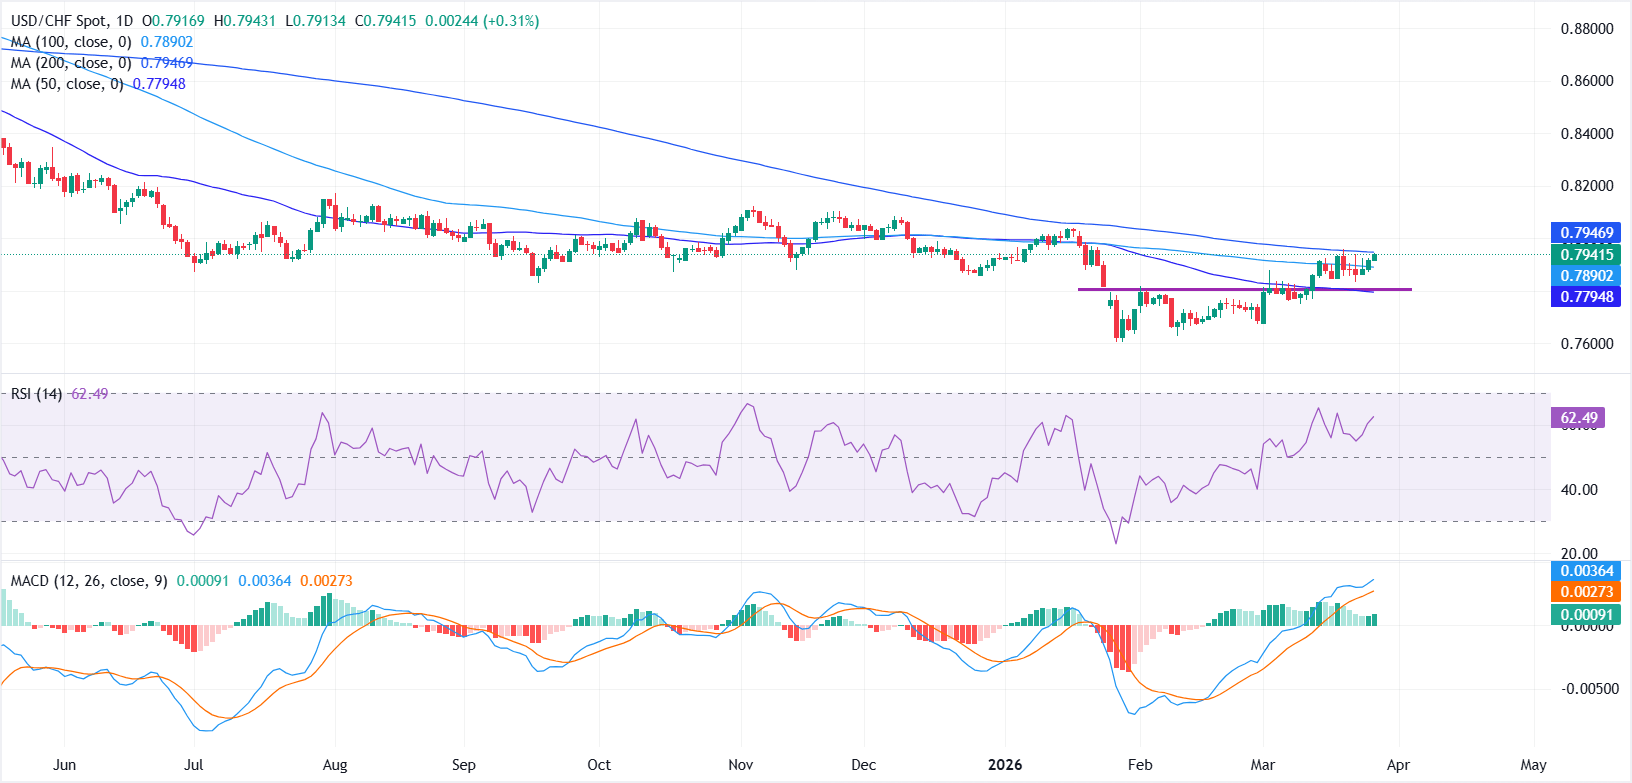
From a technical perspective, USD/CHF maintains a constructive tone after rebounding from the March 2 low near 0.7674, with price breaking above multi-week resistance around 0.7800, which closely aligns with the 50-day Simple Moving Average (SMA) at 0.7794. The move signals improving short-term momentum and a shift in near-term market structure.
The pair has also cleared the 100-day SMA at 0.7890, reinforcing the bullish bias, and is now testing the 200-day SMA at 0.7946, a key resistance zone that could determine the next directional move. A sustained break above this level may open the door toward the 0.8000 psychological level, followed by the 0.8050 region.
The Relative Strength Index (RSI) at 62 moves above the midline and signals firming upside momentum, while the Moving Average Convergence Divergence (MACD) line holds above the signal line in positive territory with a modest histogram, which reinforces a measured bullish tone rather than a strong trend.
On the downside, initial support is seen at the 100-day SMA, followed by the breakout zone near 0.7800. As long as price holds above these levels, the near-term bullish bias remains intact, while a break below could signal a resumption of the prevailing downtrend.
US Dollar Price Today
The table below shows the percentage change of US Dollar (USD) against listed major currencies today. US Dollar was the strongest against the Australian Dollar.
| USD | EUR | GBP | JPY | CAD | AUD | NZD | CHF | |
|---|---|---|---|---|---|---|---|---|
| USD | 0.22% | 0.22% | 0.14% | 0.30% | 0.68% | 0.65% | 0.31% | |
| EUR | -0.22% | -0.01% | -0.11% | 0.08% | 0.46% | 0.43% | 0.09% | |
| GBP | -0.22% | 0.00% | -0.09% | 0.08% | 0.47% | 0.43% | 0.10% | |
| JPY | -0.14% | 0.11% | 0.09% | 0.16% | 0.55% | 0.50% | 0.18% | |
| CAD | -0.30% | -0.08% | -0.08% | -0.16% | 0.39% | 0.35% | 0.01% | |
| AUD | -0.68% | -0.46% | -0.47% | -0.55% | -0.39% | -0.03% | -0.34% | |
| NZD | -0.65% | -0.43% | -0.43% | -0.50% | -0.35% | 0.03% | -0.34% | |
| CHF | -0.31% | -0.09% | -0.10% | -0.18% | -0.01% | 0.34% | 0.34% |
The heat map shows percentage changes of major currencies against each other. The base currency is picked from the left column, while the quote currency is picked from the top row. For example, if you pick the US Dollar from the left column and move along the horizontal line to the Japanese Yen, the percentage change displayed in the box will represent USD (base)/JPY (quote).
Nothing in this material constitutes investment advice, personal recommendation, investment research, an offer, or a solicitation to buy or sell any financial instrument. The content has been prepared without consideration of your individual investment objectives, financial situation, or needs, and should not be treated as such.
Past performance is not a reliable indicator of future performance and/or results. Forward-looking scenarios or forecasts are not a guarantee of future performance. Actual results may differ materially from those anticipated.
Mitrade makes no representation or warranty as to the accuracy or completeness of the information provided and accepts no liability for any loss arising from reliance on such information.
Recommended Articles


