



USD/CAD Price Forecast: Bearish indicators keep the path tilted lower
- USD/CAD slips as a weaker US Dollar supports the Canadian Dollar.
- Canada unveils tariffs on C$27.6 billion of US imports following failed trade talks.
- USD/CAD struggles to reclaim the 200-day SMA near 1.3843.
USD/CAD edges lower on Tuesday, with the Canadian Dollar (CAD) drawing support from a weaker US Dollar (USD) as traders also assess the latest tit-for-tat tariff measures between the United States (US) and Canada. At the time of writing, the pair trades around 1.3834 after retreating from an intraday high of 1.3867.
On Tuesday, Canada announced retaliatory tariffs covering C$27.6 billion worth of US goods. The duties, ranging from 15% to 50%, will apply to roughly 700 products from September 8. The move follows the United States' decision to impose 50% tariffs on a similar value of Canadian imports after trade negotiations between the two countries collapsed.
The near-term outlook favours the Loonie as the Greenback struggles to attract buyers following the return of the USD-debasement narrative. Concerns resurfaced after the US Treasury announced last week that it would increase buybacks of longer-dated government securities. The technical setup also suggests that USD/CAD risks are tilted lower.
Technical analysis
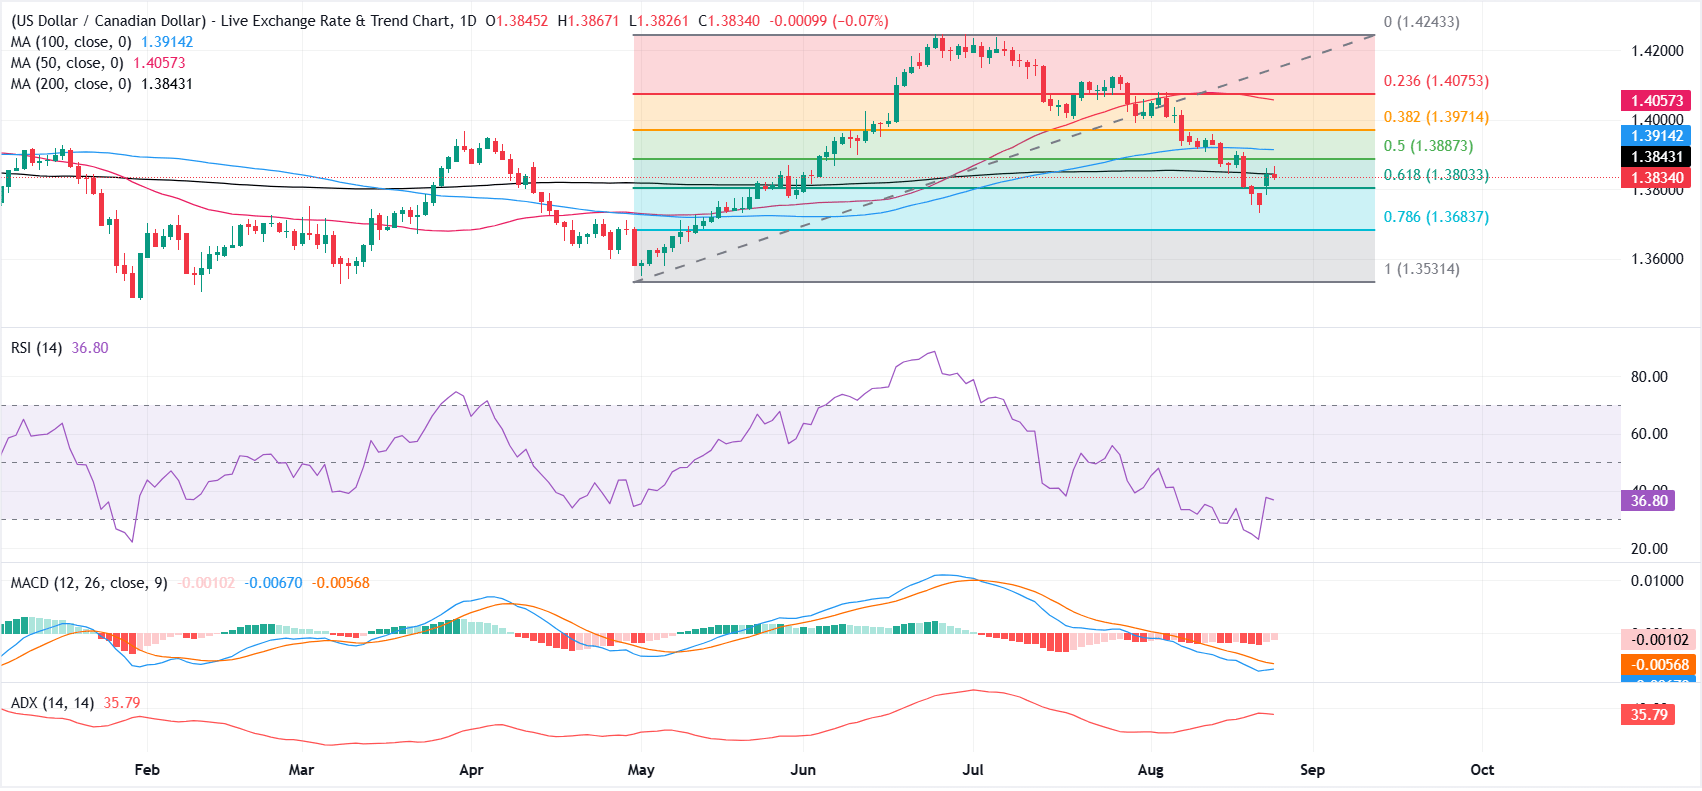
On the daily chart, USD/CAD holds below a cluster of key resistance levels. The 200-day Simple Moving Average (SMA) at 1.3843 provides the first barrier, followed by the 50.0% Fibonacci retracement at 1.3887 and the 100-day SMA at 1.3914. Higher up, the 38.2% retracement at 1.3971, the 50-day SMA at 1.4057 and the 23.6% retracement at 1.4075 form a broader resistance zone.
The Relative Strength Index (RSI) near 37 and the negative Moving Average Convergence Divergence (MACD) suggest that recovery attempts could attract sellers. Meanwhile, the Average Directional Index (ADX) at 35 points to a strong underlying trend, reinforcing the bearish outlook.
On the downside, initial support is seen at the 61.8% Fibonacci retracement near 1.3803. A break below this level would expose the 78.6% retracement at 1.3684, followed by the 100.0% retracement around 1.3531.
Only a daily close back above the 200-day SMA at 1.3843, followed by the 50.0% retracement at 1.3887, would start to ease the immediate bearish bias and open the door for a corrective recovery toward the mid-1.39s.
(The technical analysis of this story was written with the help of an AI tool. Know more.)
Canadian Dollar FAQs
The key factors driving the Canadian Dollar (CAD) are the level of interest rates set by the Bank of Canada (BoC), the price of Oil, Canada’s largest export, the health of its economy, inflation and the Trade Balance, which is the difference between the value of Canada’s exports versus its imports. Other factors include market sentiment – whether investors are taking on more risky assets (risk-on) or seeking safe-havens (risk-off) – with risk-on being CAD-positive. As its largest trading partner, the health of the US economy is also a key factor influencing the Canadian Dollar.
The Bank of Canada (BoC) has a significant influence on the Canadian Dollar by setting the level of interest rates that banks can lend to one another. This influences the level of interest rates for everyone. The main goal of the BoC is to maintain inflation at 1-3% by adjusting interest rates up or down. Relatively higher interest rates tend to be positive for the CAD. The Bank of Canada can also use quantitative easing and tightening to influence credit conditions, with the former CAD-negative and the latter CAD-positive.
The price of Oil is a key factor impacting the value of the Canadian Dollar. Petroleum is Canada’s biggest export, so Oil price tends to have an immediate impact on the CAD value. Generally, if Oil price rises CAD also goes up, as aggregate demand for the currency increases. The opposite is the case if the price of Oil falls. Higher Oil prices also tend to result in a greater likelihood of a positive Trade Balance, which is also supportive of the CAD.
While inflation had always traditionally been thought of as a negative factor for a currency since it lowers the value of money, the opposite has actually been the case in modern times with the relaxation of cross-border capital controls. Higher inflation tends to lead central banks to put up interest rates which attracts more capital inflows from global investors seeking a lucrative place to keep their money. This increases demand for the local currency, which in Canada’s case is the Canadian Dollar.
Macroeconomic data releases gauge the health of the economy and can have an impact on the Canadian Dollar. Indicators such as GDP, Manufacturing and Services PMIs, employment, and consumer sentiment surveys can all influence the direction of the CAD. A strong economy is good for the Canadian Dollar. Not only does it attract more foreign investment but it may encourage the Bank of Canada to put up interest rates, leading to a stronger currency. If economic data is weak, however, the CAD is likely to fall.
Nothing in this material constitutes investment advice, personal recommendation, investment research, an offer, or a solicitation to buy or sell any financial instrument. The content has been prepared without consideration of your individual investment objectives, financial situation, or needs, and should not be treated as such.
Past performance is not a reliable indicator of future performance and/or results. Forward-looking scenarios or forecasts are not a guarantee of future performance. Actual results may differ materially from those anticipated.
Mitrade makes no representation or warranty as to the accuracy or completeness of the information provided and accepts no liability for any loss arising from reliance on such information.
Recommended Articles


