



Google Stock Forecast: Morgan Stanley Sees TPUs Generating $200 Billion Over Next Two Years, Can Shares Return to $400?
TradingKey - Morgan Stanley's latest estimates show that as Google (GOOGL) ramps up external sales of its self-developed TPUs, Alphabet's AI chip business could become a new growth engine for Google Cloud. The bank estimates that TPU-related Google Cloud revenue could reach $84 billion in 2027 and $108 billion in 2028, totaling nearly $200 billion over the two years.
In his new estimation model, the firm's analyst Brian Nowak expects Google to sell approximately 0.3 GW of TPU systems in the second half of 2026, increasing to 3.2 GW in 2027 and further rising to 4.2 GW in 2028. Meanwhile, the bank raised its gross margin assumption for TPU system sales from 20% to 30%, believing that Google's expanded custom chip cooperation with Marvell Technology could help support higher system selling prices and profit margins.
In the past, TPUs were mainly used to support the computing power demands of Google's internal search, cloud computing, and AI products. If external sales scale up, Google will further extend its role from a major contributor of AI capital expenditure to an AI infrastructure provider. Sales, leases, and supporting cloud services for TPU systems could also open up new revenue streams for Google Cloud. The bank maintains an "Overweight" rating on Google and reiterates its target price of $400.
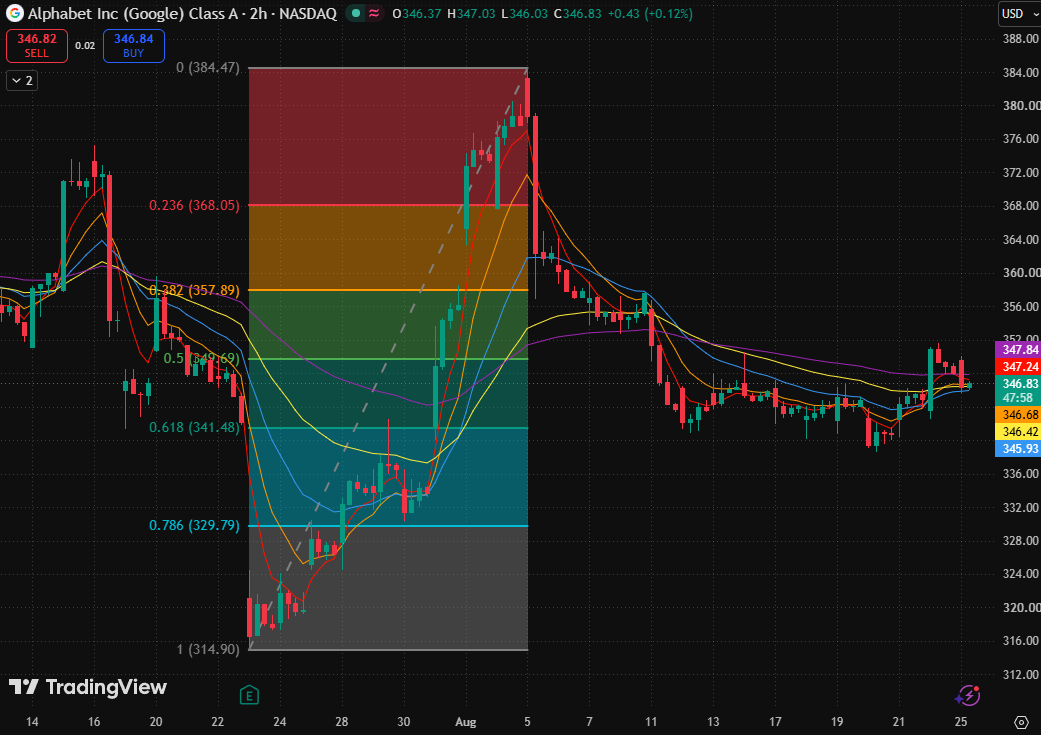
Google two-hour stock chart, Source: TradingView
Looking at the Google stock chart, after peaking around $384.47, the price experienced a rapid adjustment before finding support near the 0.618 Fibonacci retracement level ($341.48). Recent lows have not continued to break downward, and the price has entered a period of narrow-range consolidation and recovery.
Currently, moving averages are intertwined and have not yet formed a clear bullish divergence, indicating that bulls and bears are still competing. The most critical confirmation zone above is the 5-day moving average ($347.24), the 160-day moving average ($347.84), and the 0.5 Fibonacci retracement level ($349.69).
If the stock price can consistently stay above $349.69 in the future and hold this level during pullbacks, the rebound is expected to progress from moving average recovery to structural strengthening. Resistance levels above to watch include the 0.382 Fibonacci retracement level ($357.89) and the 0.236 Fibonacci retracement level ($368). If it fails to effectively reclaim this resistance zone, the current movement should still be viewed as a technical bounce following the previous decline.
If it effectively breaks below $341.48 and fails to recover on a bounce, the support structure formed near $340 will be broken, potentially opening up further downside toward the 0.786 Fibonacci retracement level ($329.79).
Nothing in this material constitutes investment advice, personal recommendation, investment research, an offer, or a solicitation to buy or sell any financial instrument. The content has been prepared without consideration of your individual investment objectives, financial situation, or needs, and should not be treated as such.
Past performance is not a reliable indicator of future performance and/or results. Forward-looking scenarios or forecasts are not a guarantee of future performance. Actual results may differ materially from those anticipated.
Mitrade makes no representation or warranty as to the accuracy or completeness of the information provided and accepts no liability for any loss arising from reliance on such information.
Recommended Articles


