



Tokyo bought the Japanese Yen a range, not a trend
- USD/JPY trades just above 159.00 inside a 44-pip session range.
- September BoJ hike odds near 82%, from roughly 23% before the July meeting.
- Tokyo core inflation forecast at 1.7% Thursday, down from 1.9%.
USD/JPY trades just above 159.00 late on Tuesday, August 25, holding a gain of under a tenth of a percent across a session that has covered 44 pips between a floor near 159.00 and a ceiling short of 159.50. Four weeks after the largest single-session currency operation Japan has ever run, the pair sits a shade beneath the midpoint of the range that operation created. That is not what a successful defence normally looks like.
What a record defence actually bought
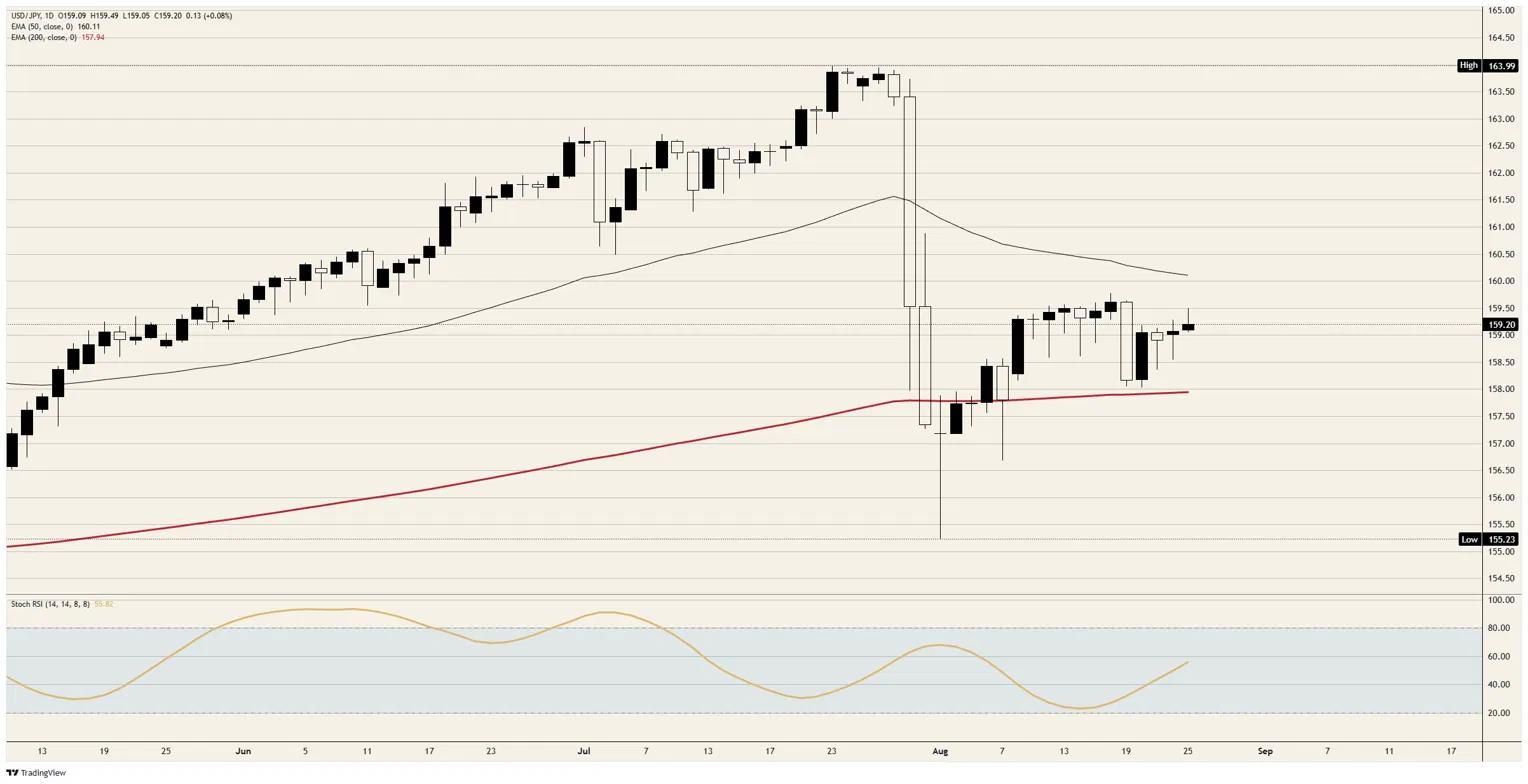
The Ministry of Finance sold a reported 8.45 trillion Yen in one session at the end of July and roughly 5.3 trillion Yen more in coordination with the US Treasury, driving the pair from just beneath 164.00 to a low just above 155.00. Close to half of that move has since been handed back, and it was handed back without a single fresh headline arguing for a weaker Yen. Intervention is supposed to buy a level rather than a retracement schedule.
What the operation did buy is a ceiling, and the tape has respected it for three weeks. The 159.50 area has capped every attempt since the first week of August, and the 50-day Exponential Moving Average (EMA) has rolled over from its late-July peak to sit near 160.00, descending into the top of that band. A price that costs trillions to defend becomes a price nobody wants to be long above, which is a smaller achievement than a stronger currency but a real one.
The funding of the operation was as unusual as its size. Reports at the time had Washington selling Euros rather than Dollars to buy Yen, which spares Japan from liquidating US Treasury holdings to pay for its own defence. That detail carries more information than the headline number, because it tells the market the ceiling has a second sponsor with a far deeper balance sheet.
An 82% hike that has not happened
Futures now price roughly 82% odds of a Bank of Japan (BoJ) increase at the September 17-18 meeting, against about 23% before the July decision. The move would take the policy rate to 1.25% from 1.00%. Set against a federal funds range of 3.50% to 3.75%, a quarter point closes almost none of the gap that made the Yen a funding currency in the first place.
That repricing came from prices rather than from the Ministry. Japanese inflation has accelerated for a second consecutive month, the July policy statement warned that core inflation would run clearly above 2% from the second half of the fiscal year, and one board member voted for 1.25% at that meeting against eight for a hold. The hike case is real, and the currency has already banked the whole of it without a single basis point being delivered.
The other half of the Yen's recent bid is American. The US Treasury's move to at least double its purchases of longer-dated debt knocked the Dollar broadly on August 19 and lifted the Yen close to 1% inside a session, before more than half of that was surrendered the following day. A currency propped up by another country's debt management and by a decision three weeks away is not propping itself up.
The week points the wrong way for the hike
Japan's own calendar this week tests that pricing rather than confirming it. The corporate services price index for July prints at 23:50 GMT on Tuesday against a 3.2% prior, and it is the cleanest available read on whether firms are passing wage costs through into what they charge each other.
Thursday at 23:30 GMT carries the block that matters. Tokyo core inflation excluding fresh food is forecast at 1.7% for August, down from 1.9%, with both the headline and the ex food and energy measures running from a 2% prior. Unemployment is expected unchanged at 2.5% and the jobs-to-applicants ratio at 1.19 from 1.18. A Tokyo core print with a one in front of it, three weeks ahead of a meeting the market has 82% priced, takes the Yen's strongest remaining argument away from it.
The American half of the pair carries more weight still. Core Personal Consumption Expenditures (PCE) prices land Wednesday, August 26 at 12:30 GMT, forecast at 0.2% MoM and 3.3% YoY, alongside second-quarter Gross Domestic Product (GDP) at 1.5% annualised. The Jackson Hole symposium opens Thursday, the Fed Chair delivers his first keynote in the job at 14:00 GMT on Friday, and speculative positioning refreshes at 19:30 GMT that evening from a net short of 52.9K Yen contracts.
Levels
Resistance: The 159.50 area has capped every rally since the first week of August, with the 50-day EMA near 160.00 directly behind it and the late-July peak just beneath 164.00 the only mark above that.
Support: The 158.50 area is the first floor, with the 200-day EMA near 158.00 rising into the base of the range and the intervention low just above 155.00 far below it.
Bias: Bearish while the 159.50 area caps. Both moving averages are closing on the range from opposite sides and only one of the two boundaries has a ministry standing behind it, so the objectives are 158.50 then the 200-day EMA near 158.00. Invalidation is a daily close above 160.00, which reclaims the 50-day EMA and puts the July highs back in play.
USD/JPY daily chart
Japanese Yen FAQs
The Japanese Yen (JPY) is one of the world’s most traded currencies. Its value is broadly determined by the performance of the Japanese economy, but more specifically by the Bank of Japan’s policy, the differential between Japanese and US bond yields, or risk sentiment among traders, among other factors.
One of the Bank of Japan’s mandates is currency control, so its moves are key for the Yen. The BoJ has directly intervened in currency markets sometimes, generally to lower the value of the Yen, although it refrains from doing it often due to political concerns of its main trading partners. The BoJ ultra-loose monetary policy between 2013 and 2024 caused the Yen to depreciate against its main currency peers due to an increasing policy divergence between the Bank of Japan and other main central banks. More recently, the gradually unwinding of this ultra-loose policy has given some support to the Yen.
Over the last decade, the BoJ’s stance of sticking to ultra-loose monetary policy has led to a widening policy divergence with other central banks, particularly with the US Federal Reserve. This supported a widening of the differential between the 10-year US and Japanese bonds, which favored the US Dollar against the Japanese Yen. The BoJ decision in 2024 to gradually abandon the ultra-loose policy, coupled with interest-rate cuts in other major central banks, is narrowing this differential.
The Japanese Yen is often seen as a safe-haven investment. This means that in times of market stress, investors are more likely to put their money in the Japanese currency due to its supposed reliability and stability. Turbulent times are likely to strengthen the Yen’s value against other currencies seen as more risky to invest in.
Nothing in this material constitutes investment advice, personal recommendation, investment research, an offer, or a solicitation to buy or sell any financial instrument. The content has been prepared without consideration of your individual investment objectives, financial situation, or needs, and should not be treated as such.
Past performance is not a reliable indicator of future performance and/or results. Forward-looking scenarios or forecasts are not a guarantee of future performance. Actual results may differ materially from those anticipated.
Mitrade makes no representation or warranty as to the accuracy or completeness of the information provided and accepts no liability for any loss arising from reliance on such information.
Recommended Articles


