



0.8600 under pressure: EUR/GBP at two-month highs following Services PMIs
- EUR/GBP bulls are testing 0.8600 after rallying nearly 0.5% so far this week.
- Eurozone and UK Services PMIs for August have been revised lower.
- ECB-BoE monetary policy divergence keeps pushing the Euro through fresh two-month highs.
The Euro (EUR) extends gains against a weaker British Pound (GBP) for the fourth consecutive day on Thursday, following downward revisions of both the Eurozone and UK Services Purchasing Managers’ Index (PMI) figures. The EUR/GBP pair maintains its bid tone, with bulls targeting a previous support area a few pips above 0.8600 after rallying nearly 0.5% so far this week.
Eurozone final HCOB Services Purchasing Managers Index (PMI) figures have been revised down to 51.6 from the 51.7 previously estimated. Later on the day, the final UK S&P Global Services PMI was revised to 52.5 from preliminary estimates of 52.8.
The Euro is drawing support from the monetary policy divergence between the European Central Bank (ECB) and the Bank of England (BoE). Investors are bracing for a quarter-point ECB rate hike later this month, especially after the hawkish comments by ECB Council member and Bundesbank President Joachim Nagel. The BoE, on the contrary, is widely expected to stand pat on rates at its September 17 meeting.
Technical Analysis: Bulls have broken above a triangle pattern
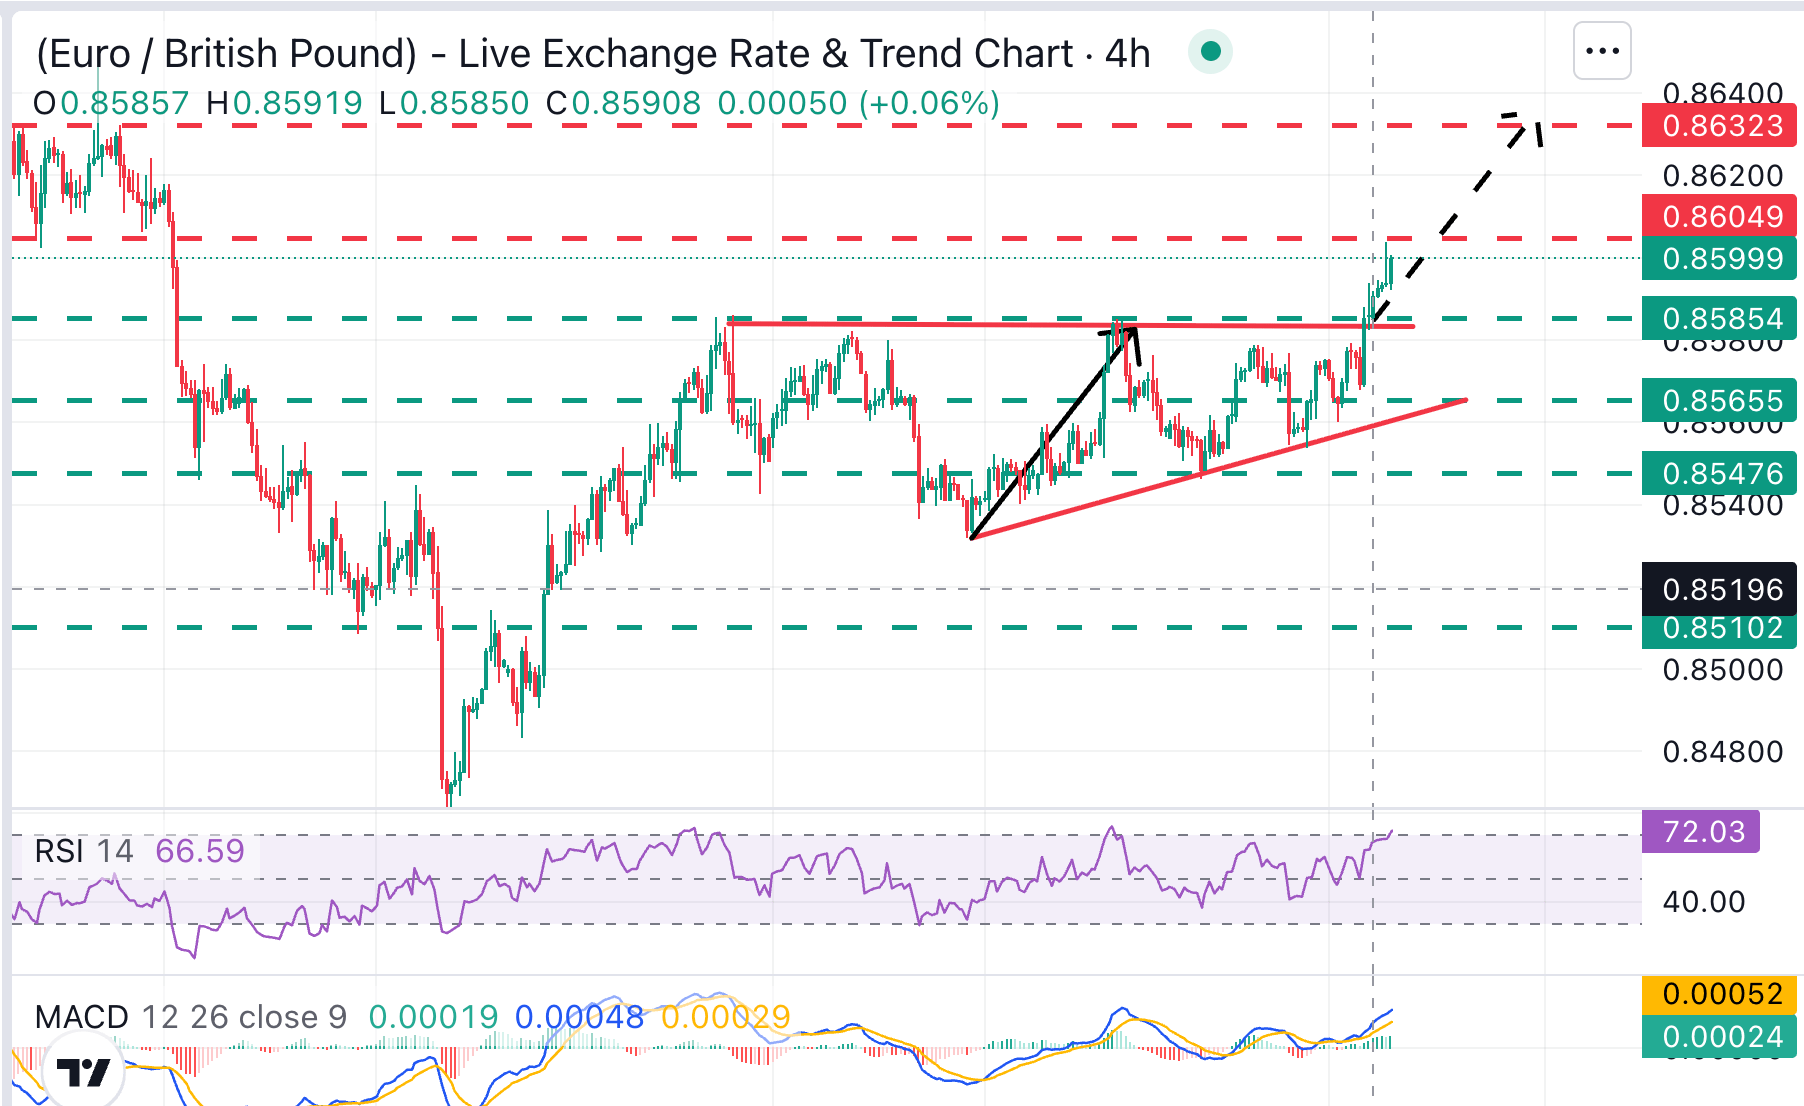
EUR/GBP broke a key resistance area between 0.8580 and 0.8585 on Wednesday, which was also the top of a triangle pattern, providing fresh hopes for bulls. Momentum indicators on the 4-hour chart remain well into bullish territory, although the Relative Strength Index (14) flirts with overbought levels, a warning that the pair might pull back before rallying higher.
Bulls are likely to struggle at a previous support area, now turned resistance, between 0.8600 and 0.8610 (June 23, 25, 30 lows). Further up, the next level would be the triangle pattern's measured target, which lies around the June 29 high, in the 0.8630 area.
On the downside, immediate support is seen at the previous top near 0.8585, followed by Wednesday's low, near 0.8565, and the triangle bottom, near 0.8560.
(The technical analysis of this story was written with the help of an AI tool. Know more.)
Euro Price Today
The table below shows the percentage change of Euro (EUR) against listed major currencies today. Euro was the strongest against the US Dollar.
| USD | EUR | GBP | JPY | CAD | AUD | NZD | CHF | |
|---|---|---|---|---|---|---|---|---|
| USD | -0.12% | -0.04% | -1.39% | -0.22% | -0.21% | -0.16% | -0.38% | |
| EUR | 0.12% | 0.08% | -1.31% | -0.15% | -0.08% | -0.10% | -0.26% | |
| GBP | 0.04% | -0.08% | -1.37% | -0.22% | -0.16% | -0.15% | -0.34% | |
| JPY | 1.39% | 1.31% | 1.37% | 1.20% | 1.23% | 1.23% | 1.05% | |
| CAD | 0.22% | 0.15% | 0.22% | -1.20% | 0.02% | 0.03% | -0.15% | |
| AUD | 0.21% | 0.08% | 0.16% | -1.23% | -0.02% | 0.00% | -0.14% | |
| NZD | 0.16% | 0.10% | 0.15% | -1.23% | -0.03% | -0.01% | -0.15% | |
| CHF | 0.38% | 0.26% | 0.34% | -1.05% | 0.15% | 0.14% | 0.15% |
The heat map shows percentage changes of major currencies against each other. The base currency is picked from the left column, while the quote currency is picked from the top row. For example, if you pick the Euro from the left column and move along the horizontal line to the US Dollar, the percentage change displayed in the box will represent EUR (base)/USD (quote).
Nothing in this material constitutes investment advice, personal recommendation, investment research, an offer, or a solicitation to buy or sell any financial instrument. The content has been prepared without consideration of your individual investment objectives, financial situation, or needs, and should not be treated as such.
Past performance is not a reliable indicator of future performance and/or results. Forward-looking scenarios or forecasts are not a guarantee of future performance. Actual results may differ materially from those anticipated.
Mitrade makes no representation or warranty as to the accuracy or completeness of the information provided and accepts no liability for any loss arising from reliance on such information.
Recommended Articles


