



Gold climbs as Yen-led US Dollar decline outweighs hawkish Fed expectations
- Gold rebounds as a sharp rally in the Japanese Yen weighs on the US Dollar.
- Elevated Bond yields and hawkish Federal Reserve expectations limit the recovery.
- Technically, immediate resistance is located at $4,450, followed by the 200-day SMA at $4,533.
Gold (XAU/USD) extends its rebound on Thursday after slipping below $4,300 to a nearly four-week low on the previous day. A sharp rally in the Japanese Yen (JPY) weighs on the US Dollar (USD), helping the precious metal regain ground. At the time of writing, XAU/USD trades around $4,425, up 0.87% on the day.
The Yen strengthens across the board for the second consecutive day. USD/JPY fell nearly 1% on Wednesday and is down around 1.50% at press time, trading near 156.35, its lowest level since August 3. The rapid move has raised speculation over another round of currency intervention or a rate check. However, Japanese authorities have not confirmed either.
The US Dollar Index (DXY), which tracks the Greenback's value against a basket of six major currencies, trades around 99.26, near a one-week low, after reaching 99.86 on Wednesday, its highest level since August 14.
A weaker US Dollar is generally positive for Gold. Still, it may not be enough to drive a stronger recovery in the yellow metal, as several near-term headwinds remain in place, even though the longer-term outlook stays supported by strong central bank purchases and investment demand.
Government Bond yields have climbed to multi-year highs across major economies as fiscal and inflation concerns deepen. Elevated Oil prices linked to the war in the Middle East are also adding to inflation expectations. The benchmark 10-year US Treasury yield trades around 4.78% after pulling back modestly from 4.81%, its highest level since October 2023. Rising yields increase the opportunity cost of holding non-yielding assets such as Gold.
Hawkish Federal Reserve (Fed) expectations pose an additional challenge, as Gold typically performs better when interest rates are low. According to the CME FedWatch Tool, traders are pricing in around a 60% chance that the US central bank will raise interest rates at its September 15-16 meeting.
Taken together, these factors could make it difficult for Gold to attract strong buying interest. Buyers may also avoid placing aggressive bullish bets ahead of Friday’s United States Nonfarm Payrolls (NFP) report, which could significantly influence expectations for the Fed’s next policy move.
Thursday’s US economic calendar features the weekly Initial Jobless Claims and the August ISM Services Purchasing Managers Index (PMI).
Technical analysis: XAU/USD tests $4,450 as buyers regain ground
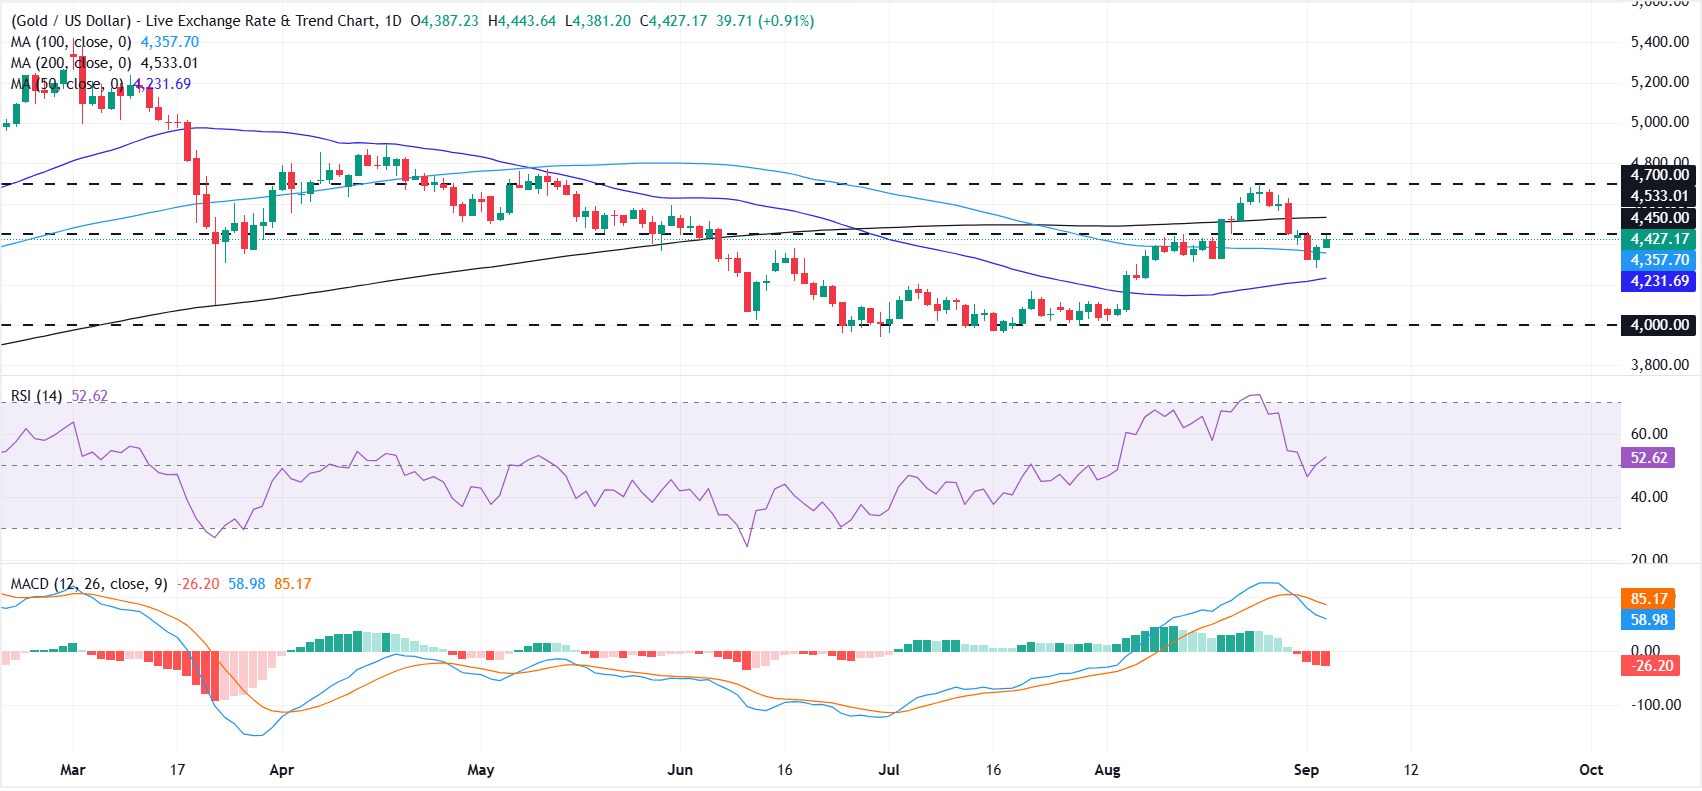
XAU/USD holds above the 50-day and 100-day Simple Moving Averages (SMAs), keeping the near-term outlook constructive. The Relative Strength Index (RSI) on the daily chart stands near 52, indicating neutral momentum. Meanwhile, the Moving Average Convergence Divergence (MACD) displays red histogram bars and remains in negative territory, suggesting that recovery attempts could remain choppy while Gold trades below the longer-term trend barrier at the 200-day SMA.
On the upside, immediate resistance is located at the horizontal level of $4,450, followed by the 200-day SMA at $4,533 and the $4,700 mark. On the downside, the psychological level of $4,400 offers initial support ahead of the 100-day SMA at $4,357 and the 50-day SMA at $4,231. A deeper decline could bring the horizontal support level of $4,000 into focus.
(The technical analysis of this story was written with the help of an AI tool. Know more.)
Gold FAQs
Gold has played a key role in human’s history as it has been widely used as a store of value and medium of exchange. Currently, apart from its shine and usage for jewelry, the precious metal is widely seen as a safe-haven asset, meaning that it is considered a good investment during turbulent times. Gold is also widely seen as a hedge against inflation and against depreciating currencies as it doesn’t rely on any specific issuer or government.
Central banks are the biggest Gold holders. In their aim to support their currencies in turbulent times, central banks tend to diversify their reserves and buy Gold to improve the perceived strength of the economy and the currency. High Gold reserves can be a source of trust for a country’s solvency. Central banks added 1,136 tonnes of Gold worth around $70 billion to their reserves in 2022, according to data from the World Gold Council. This is the highest yearly purchase since records began. Central banks from emerging economies such as China, India and Turkey are quickly increasing their Gold reserves.
Gold has an inverse correlation with the US Dollar and US Treasuries, which are both major reserve and safe-haven assets. When the Dollar depreciates, Gold tends to rise, enabling investors and central banks to diversify their assets in turbulent times. Gold is also inversely correlated with risk assets. A rally in the stock market tends to weaken Gold price, while sell-offs in riskier markets tend to favor the precious metal.
The price can move due to a wide range of factors. Geopolitical instability or fears of a deep recession can quickly make Gold price escalate due to its safe-haven status. As a yield-less asset, Gold tends to rise with lower interest rates, while higher cost of money usually weighs down on the yellow metal. Still, most moves depend on how the US Dollar (USD) behaves as the asset is priced in dollars (XAU/USD). A strong Dollar tends to keep the price of Gold controlled, whereas a weaker Dollar is likely to push Gold prices up.
Nothing in this material constitutes investment advice, personal recommendation, investment research, an offer, or a solicitation to buy or sell any financial instrument. The content has been prepared without consideration of your individual investment objectives, financial situation, or needs, and should not be treated as such.
Past performance is not a reliable indicator of future performance and/or results. Forward-looking scenarios or forecasts are not a guarantee of future performance. Actual results may differ materially from those anticipated.
Mitrade makes no representation or warranty as to the accuracy or completeness of the information provided and accepts no liability for any loss arising from reliance on such information.
Recommended Articles


