



EUR/USD Price Forecast: 20-day EMA acts as key support level
- EUR/USD gains to near 1.1610 amid weakness in the US Dollar.
- Weak US ADP Employment Change data for August has set an unfavorable backdrop for the US NFP.
- The ECB is anticipated to raise interest rates on September 10.
The Euro (EUR) is up 0.2% to near 1.1610 against the US Dollar (USD) during the European trading session on Thursday. The major currency pair gains as the US Dollar underperforms due to multiple headwinds, weak United States (US) ADP Employment Change data for August and the Federal Reserve (Fed) pushing back upside inflation risks.
US Dollar Price Today
The table below shows the percentage change of US Dollar (USD) against listed major currencies today. US Dollar was the weakest against the Japanese Yen.
| USD | EUR | GBP | JPY | CAD | AUD | NZD | CHF | |
|---|---|---|---|---|---|---|---|---|
| USD | -0.18% | -0.04% | -1.58% | -0.30% | -0.32% | -0.30% | -0.49% | |
| EUR | 0.18% | 0.14% | -1.40% | -0.17% | -0.13% | -0.18% | -0.31% | |
| GBP | 0.04% | -0.14% | -1.54% | -0.30% | -0.27% | -0.29% | -0.45% | |
| JPY | 1.58% | 1.40% | 1.54% | 1.29% | 1.29% | 1.26% | 1.11% | |
| CAD | 0.30% | 0.17% | 0.30% | -1.29% | -0.01% | -0.03% | -0.19% | |
| AUD | 0.32% | 0.13% | 0.27% | -1.29% | 0.01% | -0.02% | -0.16% | |
| NZD | 0.30% | 0.18% | 0.29% | -1.26% | 0.03% | 0.02% | -0.11% | |
| CHF | 0.49% | 0.31% | 0.45% | -1.11% | 0.19% | 0.16% | 0.11% |
The heat map shows percentage changes of major currencies against each other. The base currency is picked from the left column, while the quote currency is picked from the top row. For example, if you pick the US Dollar from the left column and move along the horizontal line to the Japanese Yen, the percentage change displayed in the box will represent USD (base)/JPY (quote).
Market experts believe that soft US ADP Employment Change data has set a challenging stage for the Nonfarm Payrolls (NFP) data scheduled for Friday.
US labor signals stay soft as ADP underwhelms ahead of NFP
Brown Brothers Harriman’s Elias Haddad points out that the latest US labor market read from ADP did little to dispel concerns about cooling demand. He notes that “the ADP August private payrolls data showed labor demand remains unimpressive,” with the economy adding “+38k private sector jobs in August (consensus: +47k) vs. +46k in July, the lowest reading since January.” Haddad cautions, however, that “the correlation between monthly change in ADP private payrolls and nonfarm payrolls (NFP) is weak,” limiting the extent to which investors can extrapolate the ADP miss into Friday’s official employment report.
Else, New York Fed Bank President John Williams said on Wednesday that “inflation expectations are contained”, and “recent data on price pressures has been encouraging", have increased doubts over upside inflation risks. The comments from Fed’s Williams at a time when market participants are worried about upside inflation risks, following remarks from Fed Chairman Kevin Warsh at the Jackson Hole Symposium, could ease fears of high inflation expectations.
On the Eurozone front, the latest Reuters poll has shown that all 65 economists surveyed said that the European Central Bank (ECB) will hike its deposit rate by 25 basis points (bps) to 2.50% in the monetary policy announcement on September 10.
EUR/USD Technical Analysis
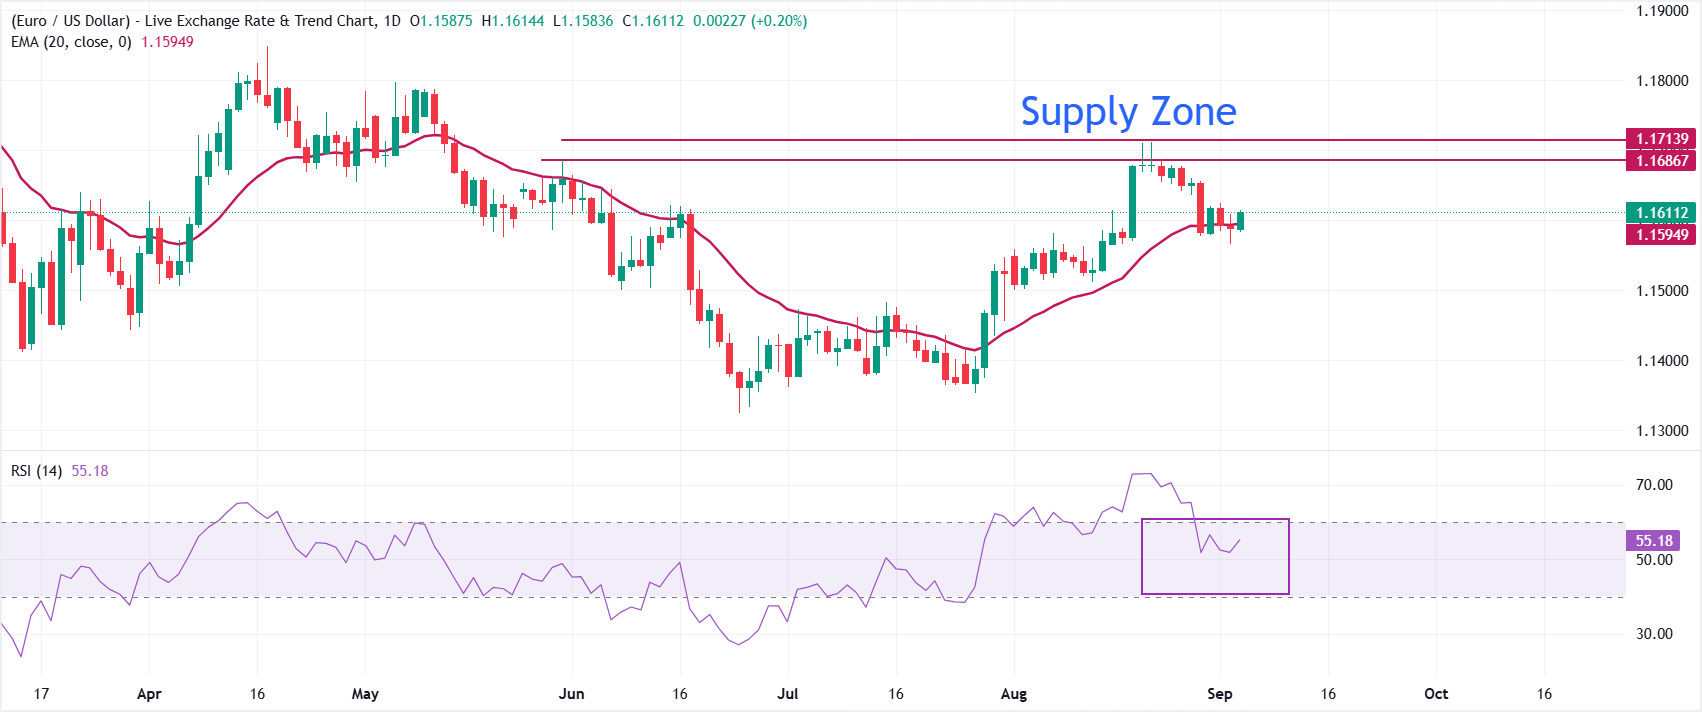
In the daily chart, EUR/USD trades at 1.1611. The pair holds a modest bullish near-term bias as spot remains above the 20-period exponential moving average (EMA) at 1.1595, suggesting underlying demand after the recent recovery from mid-1.15s. The Relative Strength Index (RSI) at 55.2 sits in neutral-to-positive territory, hinting that bullish momentum is constructive but not overstretched after pulling back from prior overbought readings above 70.
On the downside, immediate support is seen at the 20-period EMA near 1.1595, which reinforces the 1.16 area as a short-term floor while it holds. A daily close below this EMA would weaken the bullish tone and expose the pair to further downside towards the August 13 low at 1.1512.
On the upside, the 1.1687-1.1714 range will act as a key supply zone for the pair.
(The technical analysis of this story was written with the help of an AI tool. Know more.)
Economic Indicator
ECB Rate On Deposit Facility
One of the European Central Bank's three key interest rates, the rate on the deposit facility, is the rate at which banks earn interest when they deposit funds with the ECB. It is announced by the European Central Bank at each of its eight scheduled annual meetings.
Read more.Next release: Thu Sep 10, 2026 12:15
Frequency: Irregular
Consensus: -
Previous: 2.25%
Source: European Central Bank
Nothing in this material constitutes investment advice, personal recommendation, investment research, an offer, or a solicitation to buy or sell any financial instrument. The content has been prepared without consideration of your individual investment objectives, financial situation, or needs, and should not be treated as such.
Past performance is not a reliable indicator of future performance and/or results. Forward-looking scenarios or forecasts are not a guarantee of future performance. Actual results may differ materially from those anticipated.
Mitrade makes no representation or warranty as to the accuracy or completeness of the information provided and accepts no liability for any loss arising from reliance on such information.
Recommended Articles


