



New Zealand Dollar slides toward its range floor as US yields climb
- NZD/USD slides toward the 0.5600 range floor as US yields climb.
- RBNZ Official Cash Rate at 2.75% after hikes in July and September.
- Xi Jinping meets Trump at the White House on Thursday, September 24.
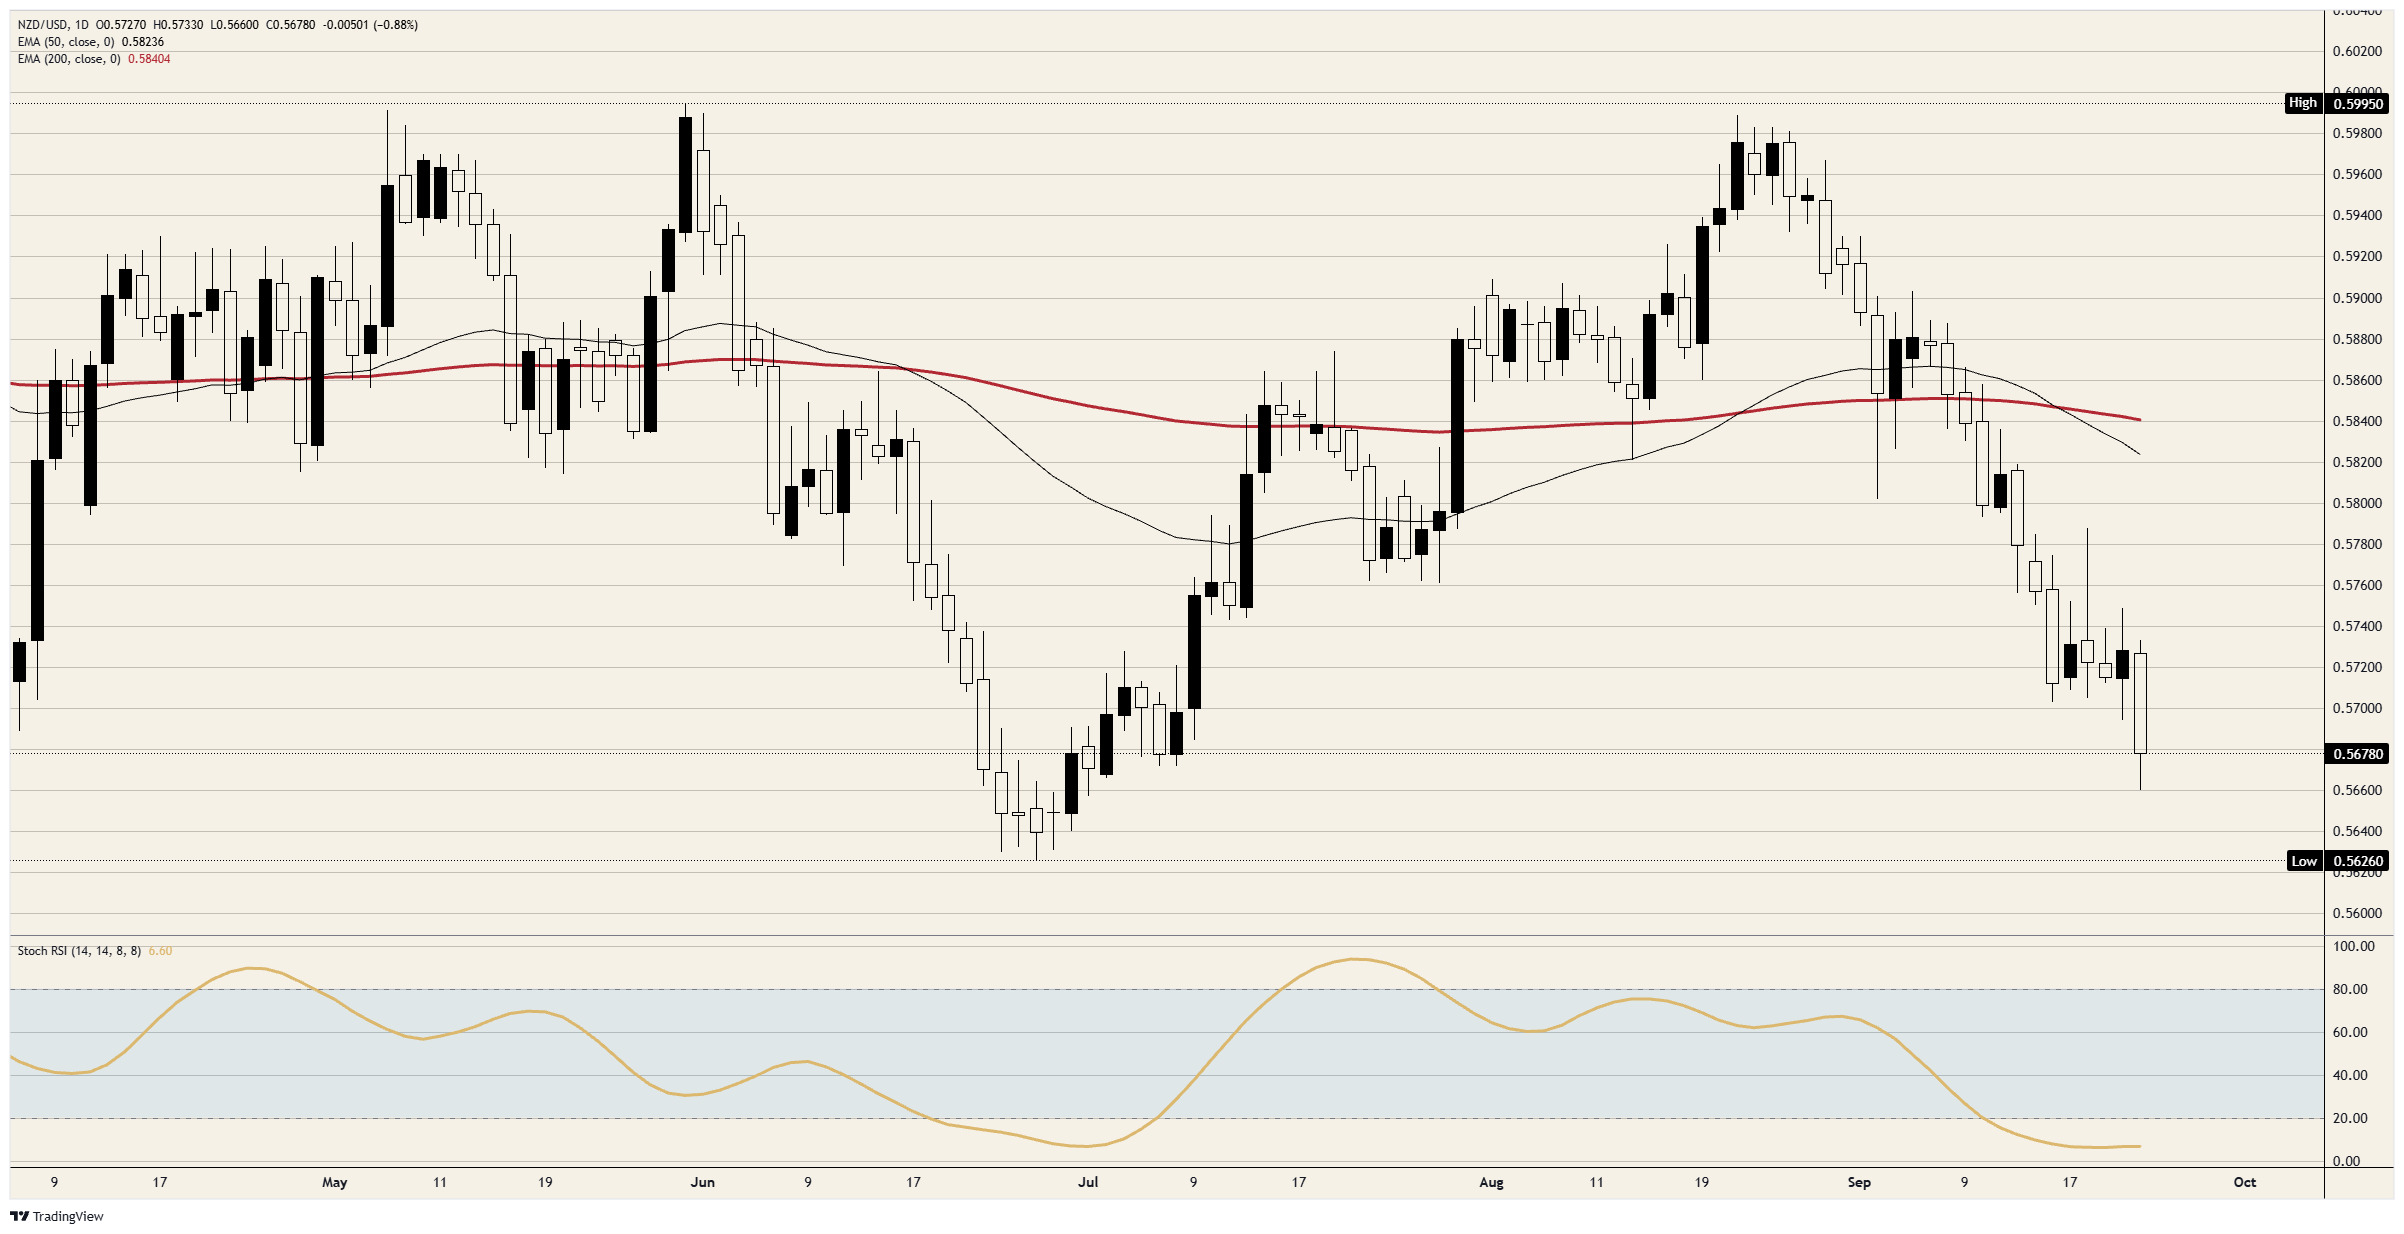
The bottom of NZD/USD's range since April is about 0.5600, and the pair is back in the lower part of it. It is trading just under 0.5700, its lowest since early July, which is about where it was before the Reserve Bank of New Zealand (RBNZ) began raising rates on July 8.
The RBNZ has raised its Official Cash Rate twice since then, to 2.75% on September 2. On Wednesday, two-year US government bond yields, which move with expectations for the Fed's rate, rose to about 4.9% after strong US business surveys.
New Zealand's own rate forecast says wait until December
The RBNZ's published forecast points to no change at its October 28 decision and a rise to 3.00% in December. The Fed decides on October 28 too, and traders see better-than-even odds of a Fed increase that day. RBNZ Governor Breman has said near-term inflation could run above the bank's forecast if Crude Oil stays expensive, which, taken at its word, is a warning about the forecast and not a promise of a hike.
New Zealand's biggest customer is at the White House on Thursday
China is New Zealand's largest export market, and Chinese President Xi meets President Trump at the White House on Thursday. Analysts expect a visit heavy on ceremony and light on trade deals. The White House's published plan for the welcome ceremony goes as far as the number of military personnel taking part, 479.
Levels and bias
Resistance: 0.5700 failed as a floor on Wednesday after holding every daily close since September 16. Above it, 0.5750 capped Monday and Tuesday.
Support: Just above 0.5650 is Wednesday's low, the lowest since early July. The late-June low just above 0.5600 marks the bottom of the range.
Bias: The lean is long only from the 0.5600 area, with 0.5700 and then 0.5750 as objectives. The daily Stochastic Relative Strength Index (Stoch RSI) has been stuck near 7 for a week, so the selling is stretched. A daily close under 0.5600 would mean the range has broken and the long is wrong.
NZD/USD daily chart
New Zealand Dollar FAQs
The New Zealand Dollar (NZD), also known as the Kiwi, is a well-known traded currency among investors. Its value is broadly determined by the health of the New Zealand economy and the country’s central bank policy. Still, there are some unique particularities that also can make NZD move. The performance of the Chinese economy tends to move the Kiwi because China is New Zealand’s biggest trading partner. Bad news for the Chinese economy likely means less New Zealand exports to the country, hitting the economy and thus its currency. Another factor moving NZD is dairy prices as the dairy industry is New Zealand’s main export. High dairy prices boost export income, contributing positively to the economy and thus to the NZD.
The Reserve Bank of New Zealand (RBNZ) aims to achieve and maintain an inflation rate between 1% and 3% over the medium term, with a focus to keep it near the 2% mid-point. To this end, the bank sets an appropriate level of interest rates. When inflation is too high, the RBNZ will increase interest rates to cool the economy, but the move will also make bond yields higher, increasing investors’ appeal to invest in the country and thus boosting NZD. On the contrary, lower interest rates tend to weaken NZD. The so-called rate differential, or how rates in New Zealand are or are expected to be compared to the ones set by the US Federal Reserve, can also play a key role in moving the NZD/USD pair.
Macroeconomic data releases in New Zealand are key to assess the state of the economy and can impact the New Zealand Dollar’s (NZD) valuation. A strong economy, based on high economic growth, low unemployment and high confidence is good for NZD. High economic growth attracts foreign investment and may encourage the Reserve Bank of New Zealand to increase interest rates, if this economic strength comes together with elevated inflation. Conversely, if economic data is weak, NZD is likely to depreciate.
The New Zealand Dollar (NZD) tends to strengthen during risk-on periods, or when investors perceive that broader market risks are low and are optimistic about growth. This tends to lead to a more favorable outlook for commodities and so-called ‘commodity currencies’ such as the Kiwi. Conversely, NZD tends to weaken at times of market turbulence or economic uncertainty as investors tend to sell higher-risk assets and flee to the more-stable safe havens.
Nothing in this material constitutes investment advice, personal recommendation, investment research, an offer, or a solicitation to buy or sell any financial instrument. The content has been prepared without consideration of your individual investment objectives, financial situation, or needs, and should not be treated as such.
Past performance is not a reliable indicator of future performance and/or results. Forward-looking scenarios or forecasts are not a guarantee of future performance. Actual results may differ materially from those anticipated.
Mitrade makes no representation or warranty as to the accuracy or completeness of the information provided and accepts no liability for any loss arising from reliance on such information.
Recommended Articles


