



Australian Dollar tumbles amid soaring US yields, ahead of jobs data
- AUD/USD slides over 1% as Treasury yields surge.
- Strong US PMIs reinforce case for additional Fed tightening.
- Weak Australian PMIs leave jobs data as next major test.
The Aussie Dollar stumbles over 1% against the US Dollar on Wednesday as US Treasury yields soar, with the US 5- and 10-year T-note yields surpassing the 5% threshold amid investor confidence in further Federal Reserve tightening. The AUD/USD trades at 0.7039 after peaking at 0.7118.
AUD/USD falls as US bond yields reach the 5% threshold, amid Fed tightening speculation
Market sentiment soured amid rising global bond yields, especially US yields, which boosted the Dollar. The US 5-year Treasury yield rose 17 basis points to 4.99%, while the 10-year T-note surged 15.5 basis points to 5.11%, its highest level since 2007.
Consequently, the US Dollar Index (DXY), which tracks the performance of the US dollar against six other currencies, gained 0.57% to 101.25.
Data in the US revealed that business activity in September in the manufacturing and services sector showed the resilience of the US economy amid difficult conditions and external shocks. This was recognized last Wednesday by the Fed Chair, Kevin Warsh, at his press conference.
The S&P Global Manufacturing PMI came at 57, up from 53.9, exceeding forecasts of 53.5. The services index rose from 56.5 to 58.7, above estimates of 56.
Before the US data release, Fed Governor Michael Barr said that further rate increases may be needed to bring inflation back to the central bank’s 2% target. This reinforces concerns that energy-driven price pressures can push the Fed to keep rates higher for longer.
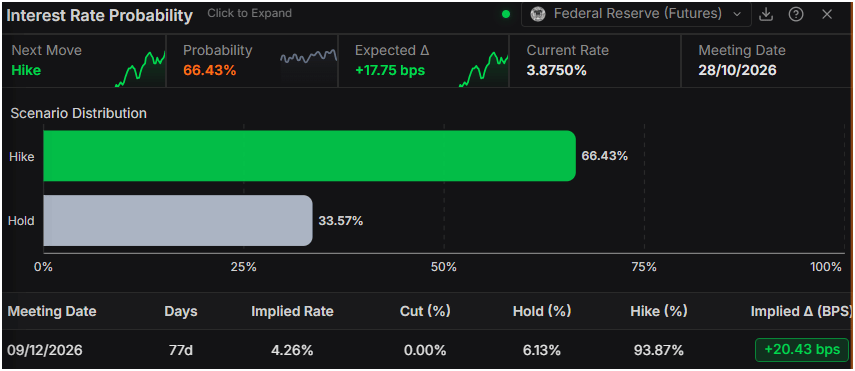
Hence, investors ramped up their Fed-hawkish bets, and for the October meeting, odds of a 25 bps rate hike edged up from around 52% to 66%, while for the December meeting, they stood at 93%, according to Prime Terminal.
In Australia, S&P Global revealed that September’s Manufacturing PMI contracted, while the Services index slowed, dragging the S&P Global Composite PMI from 52.7 to 50.8.
Ahead in the Aussie economic schedule is jobs data. The Employment Change in August is expected to improve from -15.8K to 20K. The Unemployment Rate is foreseen to remain unchanged at 4.5%.
AUD/USD Price Forecast: Technical Outlook
In the daily chart, AUD/USD trades at 0.7041, keeping a bearish near-term bias as it slips beneath the latest reading of the triple simple moving average (SMA) cluster around 0.7092. Price is pressing against a tested rising trend-line support derived from the 0.6865 start point, while a broader set of upward trend lines from 0.6833–0.6897 still run below the market and hint at an underlying medium-term constructive structure. The Relative Strength Index (14) has retreated to the mid-30s, suggesting weakening momentum and leaving the pair vulnerable while capped under the overhead moving average resistance.
On the topside, immediate resistance is seen at the triple SMA area near 0.7092, with a more significant horizontal barrier at 0.7198 likely to limit any recovery attempts. On the downside, the first line of demand is the tested rising trend line around 0.7040, with successive upward trend-line supports clustered just below price reinforcing a gradual base rather than a single, precise floor; a clear break under this pivot zone would open the way to a deeper slide within the broader bearish bias.
(The technical analysis of this story was written with the help of an AI tool. Know more.)
Australian Dollar Price Today
The table below shows the percentage change of Australian Dollar (AUD) against listed major currencies today. Australian Dollar was the strongest against the New Zealand Dollar.
| USD | EUR | GBP | JPY | CAD | AUD | NZD | CHF | |
|---|---|---|---|---|---|---|---|---|
| USD | 0.57% | 0.79% | 0.55% | 0.25% | 1.07% | 0.90% | 0.46% | |
| EUR | -0.57% | 0.20% | -0.02% | -0.32% | 0.52% | 0.32% | -0.11% | |
| GBP | -0.79% | -0.20% | -0.19% | -0.50% | 0.30% | 0.14% | -0.24% | |
| JPY | -0.55% | 0.02% | 0.19% | -0.30% | 0.49% | 0.34% | -0.03% | |
| CAD | -0.25% | 0.32% | 0.50% | 0.30% | 0.81% | 0.66% | 0.28% | |
| AUD | -1.07% | -0.52% | -0.30% | -0.49% | -0.81% | -0.18% | -0.52% | |
| NZD | -0.90% | -0.32% | -0.14% | -0.34% | -0.66% | 0.18% | -0.36% | |
| CHF | -0.46% | 0.11% | 0.24% | 0.03% | -0.28% | 0.52% | 0.36% |
The heat map shows percentage changes of major currencies against each other. The base currency is picked from the left column, while the quote currency is picked from the top row. For example, if you pick the Australian Dollar from the left column and move along the horizontal line to the US Dollar, the percentage change displayed in the box will represent AUD (base)/USD (quote).
Nothing in this material constitutes investment advice, personal recommendation, investment research, an offer, or a solicitation to buy or sell any financial instrument. The content has been prepared without consideration of your individual investment objectives, financial situation, or needs, and should not be treated as such.
Past performance is not a reliable indicator of future performance and/or results. Forward-looking scenarios or forecasts are not a guarantee of future performance. Actual results may differ materially from those anticipated.
Mitrade makes no representation or warranty as to the accuracy or completeness of the information provided and accepts no liability for any loss arising from reliance on such information.
Recommended Articles


