


CFDs are complex instruments and come with a high risk of losing money rapidly due to leverage. 83% of retail investor accounts lose money when trading CFDs with this provider. You should consider whether you understand how CFDs work and whether you can afford to take the high risk of losing your money.

GBP/JPY Price Forecast: Bulls challenge 210.00 as breakout looms

Source Fxstreet
  • GBP/JPY extends gains as buyers challenge descending resistance near 210.00.
  • RSI approaches neutral, signaling improving momentum despite broader consolidation.
  • Break above 210.00 exposes 211.28 and 50-day SMA at 211.84.

The GBP/JPY extends its modest gains for two straight days, up 0.16% as the cross-pair continues to consolidate near the 210.00 figure with no clear bias, while the Relative Strength Index (RSI) drifts higher towards its 50-neutral level, an indication that buyers are stepping in.

GBP/JPY Price Forecast: Technical outlook

As of writing, a downslope resistance trendline near 209.80-210.00 is being tested by buyers, who were quickly rejected on Monday after hitting a weekly high of 209.99.

Worth noting that the day’s price action shows that buying pressure is building after GBP/JPY reached a low of the day (LOD) below 209.00, respecting a support trendline tested three times, an indication that further upside is seen.

A decisive breakout above 210.00. puts into play the September 18 cycle high of 211.28. Further gains are seen beyond that area, with the 50-day SMA seen as a key supply zone at 211.84.

Conversely, for a bearish continuation, GBP/JPY must drop below 209.00 and clear the support trendline, which caps losses, with the next support at 206.89, the September 30 low.

GBP/JPY Price Forecast: Technical outlook
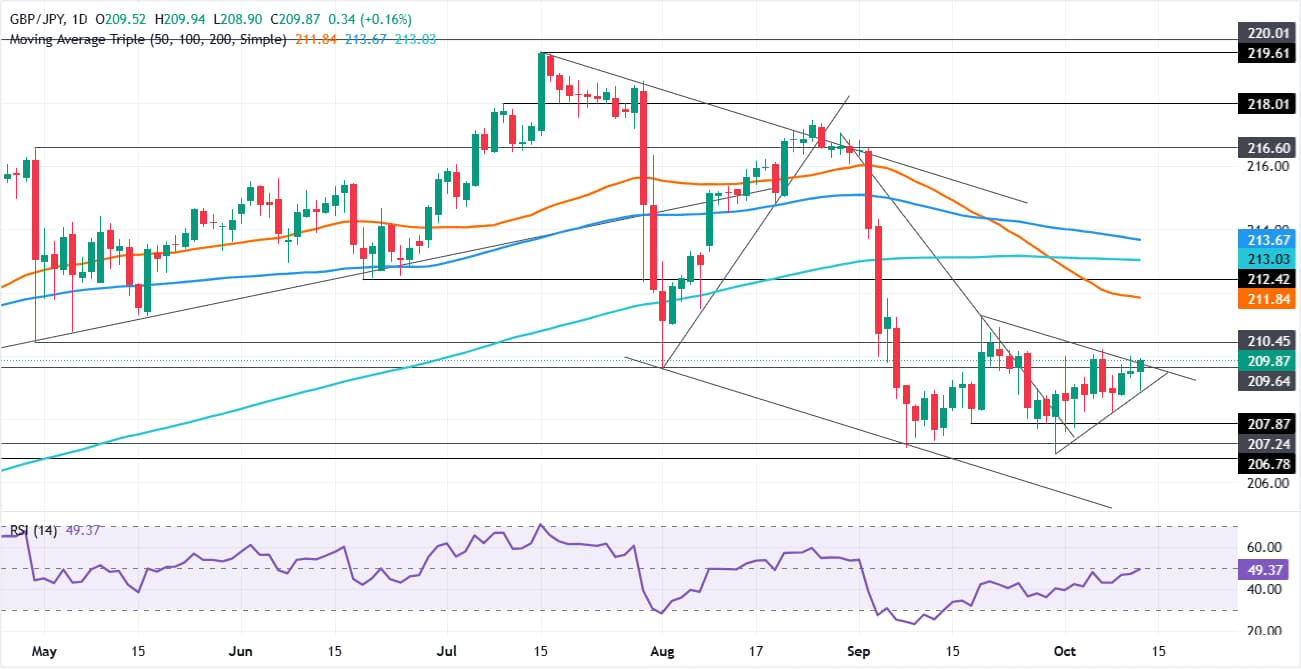
GBP/JPY daily chart

Japanese Yen Price Today

The table below shows the percentage change of Japanese Yen (JPY) against listed major currencies today. Japanese Yen was the strongest against the US Dollar.

USD EUR GBP JPY CAD AUD NZD CHF
USD -0.38% -0.34% -0.17% -0.45% -0.34% -0.46% -0.26%
EUR 0.38% 0.03% 0.21% -0.05% 0.03% -0.07% 0.13%
GBP 0.34% -0.03% 0.15% -0.13% -0.01% -0.14% 0.10%
JPY 0.17% -0.21% -0.15% -0.27% -0.16% -0.28% -0.06%
CAD 0.45% 0.05% 0.13% 0.27% 0.11% -0.01% 0.21%
AUD 0.34% -0.03% 0.01% 0.16% -0.11% -0.12% 0.09%
NZD 0.46% 0.07% 0.14% 0.28% 0.00% 0.12% 0.23%
CHF 0.26% -0.13% -0.10% 0.06% -0.21% -0.09% -0.23%

The heat map shows percentage changes of major currencies against each other. The base currency is picked from the left column, while the quote currency is picked from the top row. For example, if you pick the Japanese Yen from the left column and move along the horizontal line to the US Dollar, the percentage change displayed in the box will represent JPY (base)/USD (quote).

Disclaimer: The content available on Mitrade Insights is provided for informational and marketing purposes only. It has not been prepared in accordance with legal requirements designed to promote the independence of investment research and is not subject to any prohibition on dealing ahead of the dissemination of investment research
Nothing in this material constitutes investment advice, personal recommendation, investment research, an offer, or a solicitation to buy or sell any financial instrument. The content has been prepared without consideration of your individual investment objectives, financial situation, or needs, and should not be treated as such.
Past performance is not a reliable indicator of future performance and/or results. Forward-looking scenarios or forecasts are not a guarantee of future performance. Actual results may differ materially from those anticipated.
Mitrade makes no representation or warranty as to the accuracy or completeness of the information provided and accepts no liability for any loss arising from reliance on such information.
placeholder
Bitcoin Open Interest Plunges: Derivatives 'Flush Out' May Signal Major BottomBitcoin open interest has seen its sharpest 30-day drop of the cycle, with 1.3 million BTC in futures wiped out as price falls over 30% from $126,000 — a deleveraging that analyst “Darkfost” says could mark a bottom if BTC can later reclaim the $90,000–$96,000 zone and revive the bull trend.
Author  Mitrade
Nov 24, 2025
Bitcoin open interest has seen its sharpest 30-day drop of the cycle, with 1.3 million BTC in futures wiped out as price falls over 30% from $126,000 — a deleveraging that analyst “Darkfost” says could mark a bottom if BTC can later reclaim the $90,000–$96,000 zone and revive the bull trend.
placeholder
Meme Coins Price Prediction: Dogecoin, Shiba Inu, Pepe rally on Venezuela’s shadow BTC reserveMeme coins such as Dogecoin (DOGE), Shiba Inu (SHIB), and Pepe (PEPE) are leading the cryptocurrency market rally driven by the US cross-border operation to capture Venezuelan President Nicolás Maduro. Dogecoin extends its gain for the fifth consecutive day while SHIB and PEPE take a pause.
Author  FXStreet
Jan 05, Mon
Meme coins such as Dogecoin (DOGE), Shiba Inu (SHIB), and Pepe (PEPE) are leading the cryptocurrency market rally driven by the US cross-border operation to capture Venezuelan President Nicolás Maduro. Dogecoin extends its gain for the fifth consecutive day while SHIB and PEPE take a pause.
placeholder
WTI consolidates below $84.50, two-week top as bullish bias remains amid Hormuz standoffWest Texas Intermediate (WTI) – the benchmark US Crude Oil price – extends its consolidative price move through the first half of the European session and currently trades near the $84.25-$84.30 area, close to a two-week high set earlier this Tuesday.
Author  FXStreet
Aug 18, Tue
West Texas Intermediate (WTI) – the benchmark US Crude Oil price – extends its consolidative price move through the first half of the European session and currently trades near the $84.25-$84.30 area, close to a two-week high set earlier this Tuesday.
placeholder
BTC holds recent gains above 50-day EMA amid improving momentumBitcoin (BTC) slides slightly but holds most of the recent gains, reclaiming the 50-day Exponential Moving Average (EMA) at $64,300 at the time of writing on Tuesday after rising 2.5% the previous day.
Author  FXStreet
Aug 18, Tue
Bitcoin (BTC) slides slightly but holds most of the recent gains, reclaiming the 50-day Exponential Moving Average (EMA) at $64,300 at the time of writing on Tuesday after rising 2.5% the previous day.
placeholder
Ripple and Stellar outlook: XRP ETF demand strengthens, XLM RWA market hits $4 billion milestoneRipple (XRP) and Stellar (XLM) are showing signs of recovery on Tuesday after rebounding slightly the previous day, following double-digit corrections last week.
Author  FXStreet
Sep 01, Tue
Ripple (XRP) and Stellar (XLM) are showing signs of recovery on Tuesday after rebounding slightly the previous day, following double-digit corrections last week.
Related Instrument
goTop
quote