

Gold reclaims $5,200 as trade turmoil and Iran tensions lift haven demand
- Gold jumps after the Supreme Court of the United States blocks Donald Trump’s tariffs, stoking policy uncertainty.
- Middle East tensions and potential US strike on Iran drive haven flows into bullion.
- Lower Treasury yields and softer DXY outweigh sticky PCE inflation and cautious Federal Reserve rhetoric.
Gold rallies for the fourth straight day, reclaiming the $5,200 milestone late during the North American session on Monday as the Greenback retreats on uncertainty over US trade policies after the US Supreme Court ruled against the International Emergency Economic Powers Act (IEEPA) duties imposed by the Trump administration. At the time of writing, XAU/USD gains nearly 2%.
XAU/USD surges nearly 2% as Dollar weakness and geopolitical risks fuel a third fourth daily gain
The SCOTUS decision last Friday prompted Trump to quickly impose 10% global tariffs after the announcement. Nevertheless, he increased levies to 15%, the highest level permitted by the law under Section 122 tariffs, expiring 150 days after being enacted.
This and growing tensions in the Middle East keep investors risk averse, with ebbs and flows pushing bullion prices towards a four-week high at $5,219.
The New York Times reported that Washington is considering a targeted strike on Iran, followed by a larger attack aimed to depose the Supreme Leader by force. Talks are set to resume in Geneva on Thursday, keeping investors nervous and bullion prices underpinned.
The US embassy in Beirut ordered the departure of non-emergency US government personnel and their family members on Monday.
Gold shrugs off high US inflation, Fed hawkish rhetoric
Last week, US economic data showed that the economy decelerated, yet grew at a 1.4% QoQ pace in Q4 2025. Meanwhile, the Federal Reserve’s preferred inflation gauge, the Core Personal Consumption Expenditures (PCE) Price Index, rose by 3% in December, which could dent the Fed from reducing interest rates at next month’s meeting.
Money markets data shows the swaps market is pricing in 55 basis points of easing, according to Prime Market Terminal data.
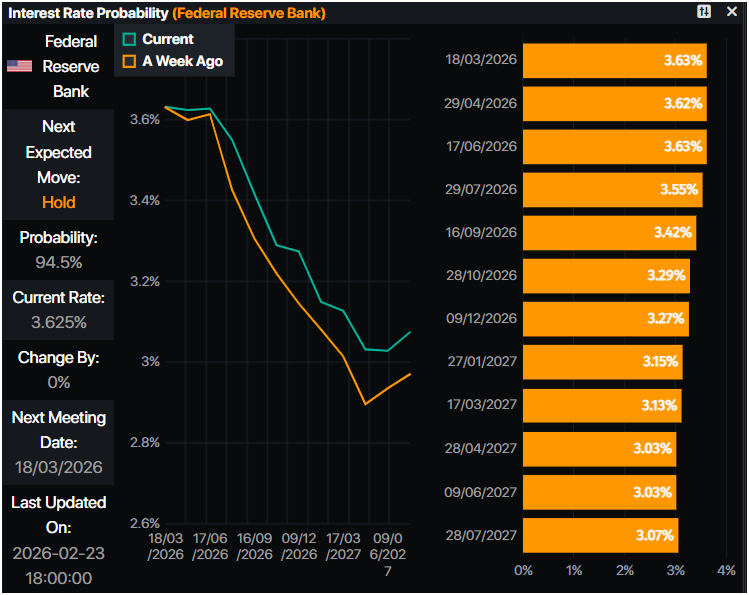
Recently, Fed Governor Christopher Waller was slightly neutral, opening the door to keep interest rates steady if February’s jobs report comes as solid as January’s one. Nevertheless, he emphasized that he favors a 25-basis-point (bps) rate cut if January’s data is downwardly revised.
The US Dollar Index (DXY), which measures the buck’s performance versus six other currencies, is down 0.15% at 97.64. US Treasury yields, which correlate inversely to Gold prices, are down, with the US 10-year Treasury note yield plunging six basis points to 4.025%.
US economic schedule in the week
The US economic docket will feature the ADP Employment Change 4-week average, the Conference Board (CB) Consumer Confidence, Initial Jobless Claims and the Producer Price Index (PPI) for January.
Alongside this, traders will eye speeches by Federal Reserve officials and US President Donald Trump's State of the Union.
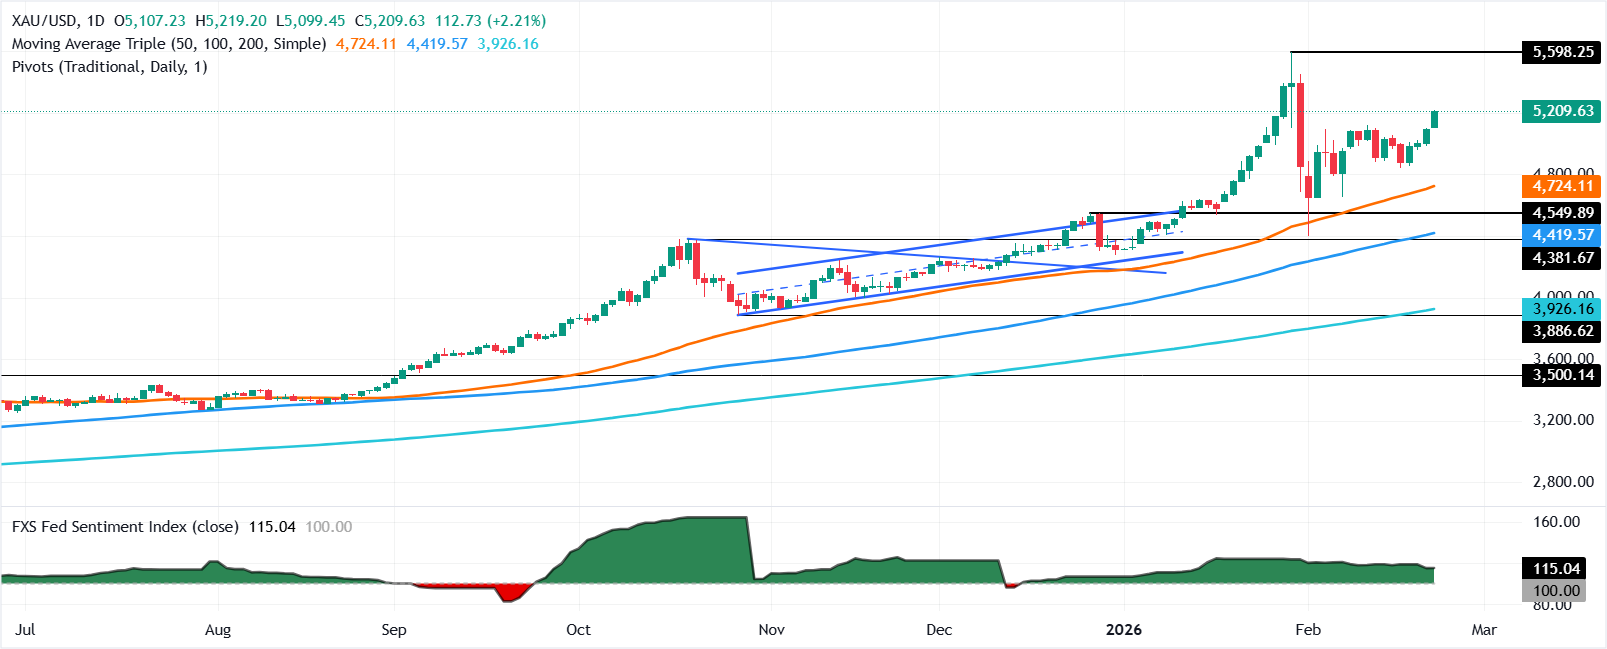
XAU/USD Price Forecast: Gold poised to extend gains above $5,300
Gold’s uptrend remains intact after clearing two crucial key resistance levels, the $5,100 and $5,200 figures. The Relative Strength Index (RSI) shows that buyers are gathering some steam as the index cleared its latest peak, an indication of the uptrend’s strength.
A breach of $5,200 exposes $5,250, followed by the January 30 high at $5,451. On further strength, the next stop is $5,500, followed by the record high near $5,600. Conversely, if XAU/USD drops below $5,100, the first support would be the 20-day Simple Moving Average (SMA) at $5,025, ahead of the 100-day SMA at $4,702.
Gold FAQs
Gold has played a key role in human’s history as it has been widely used as a store of value and medium of exchange. Currently, apart from its shine and usage for jewelry, the precious metal is widely seen as a safe-haven asset, meaning that it is considered a good investment during turbulent times. Gold is also widely seen as a hedge against inflation and against depreciating currencies as it doesn’t rely on any specific issuer or government.
Central banks are the biggest Gold holders. In their aim to support their currencies in turbulent times, central banks tend to diversify their reserves and buy Gold to improve the perceived strength of the economy and the currency. High Gold reserves can be a source of trust for a country’s solvency. Central banks added 1,136 tonnes of Gold worth around $70 billion to their reserves in 2022, according to data from the World Gold Council. This is the highest yearly purchase since records began. Central banks from emerging economies such as China, India and Turkey are quickly increasing their Gold reserves.
Gold has an inverse correlation with the US Dollar and US Treasuries, which are both major reserve and safe-haven assets. When the Dollar depreciates, Gold tends to rise, enabling investors and central banks to diversify their assets in turbulent times. Gold is also inversely correlated with risk assets. A rally in the stock market tends to weaken Gold price, while sell-offs in riskier markets tend to favor the precious metal.
The price can move due to a wide range of factors. Geopolitical instability or fears of a deep recession can quickly make Gold price escalate due to its safe-haven status. As a yield-less asset, Gold tends to rise with lower interest rates, while higher cost of money usually weighs down on the yellow metal. Still, most moves depend on how the US Dollar (USD) behaves as the asset is priced in dollars (XAU/USD). A strong Dollar tends to keep the price of Gold controlled, whereas a weaker Dollar is likely to push Gold prices up.
Nothing in this material constitutes investment advice, personal recommendation, investment research, an offer, or a solicitation to buy or sell any financial instrument. The content has been prepared without consideration of your individual investment objectives, financial situation, or needs, and should not be treated as such.
Past performance is not a reliable indicator of future performance and/or results. Forward-looking scenarios or forecasts are not a guarantee of future performance. Actual results may differ materially from those anticipated.
Mitrade makes no representation or warranty as to the accuracy or completeness of the information provided and accepts no liability for any loss arising from reliance on such information.
Recommended Articles


