

Gold retreats from monthly peak amid modest USD strength; lacks follow-through selling
- Gold attracts heavy selling on Tuesday and reverses a major part of the previous day’s gains.
- A modest USD uptick and signs of stability in the equity markets undermine the commodity.
- Fed rate cut bets, trade jitters, and geopolitical risks could limit losses for the precious metal.
Gold (XAU/USD) retreats sharply from the $5,250 level, or a fresh monthly peak touched during the Asian session, and for now, seems to have snapped a four-day winning streak. Following the previous day's knee-jerk fall in reaction to US President Donald Trump's new global tariffs and the subsequent bounce, the US Dollar (USD) attracts fresh buyers in the wake of the US Federal Reserve's (Fed) hawkish outlook. This, in turn, is seen as a key factor exerting downward pressure on the commodity.
In fact, minutes from the January FOMC meeting showed last week that several Fed officials judged that additional policy easing may not be warranted until there was a clear indication that the progress of disinflation was firmly back on track. Adding to this, Governor Christopher Waller said on Monday that he was open to leaving interest rates on hold at the March meeting if the upcoming February jobs data indicates the US labor market had "pivoted to a more solid footing" after a weak 2025.
However, the CME Group's FedWatch Tool indicates that traders are still pricing in the possibility of three 25-basis-point (bps) rate cuts by the Fed this year, which should act as a tailwind for the non-yielding Gold. Moreover, concerns about the potential economic fallout from Trump's trade policies might keep a lid on any meaningful USD appreciation and contribute to limiting the downside for the precious metal, warranting some caution for bearish traders and positioning for deeper losses.
Apart from this, worries about potential military conflict in the Middle East could help limit the downside for the safe-haven Gold ahead of the third round of US-Iran nuclear talks. This, in turn, makes it prudent to wait for strong follow-through selling before confirming the XAU/USD pair's one-week-old uptrend has run out of steam. Traders now look forward to the US macro data, which, along with speeches from influential FOMC members, could provide some impetus later this Thursday.
XAU/USD 4-hour chart
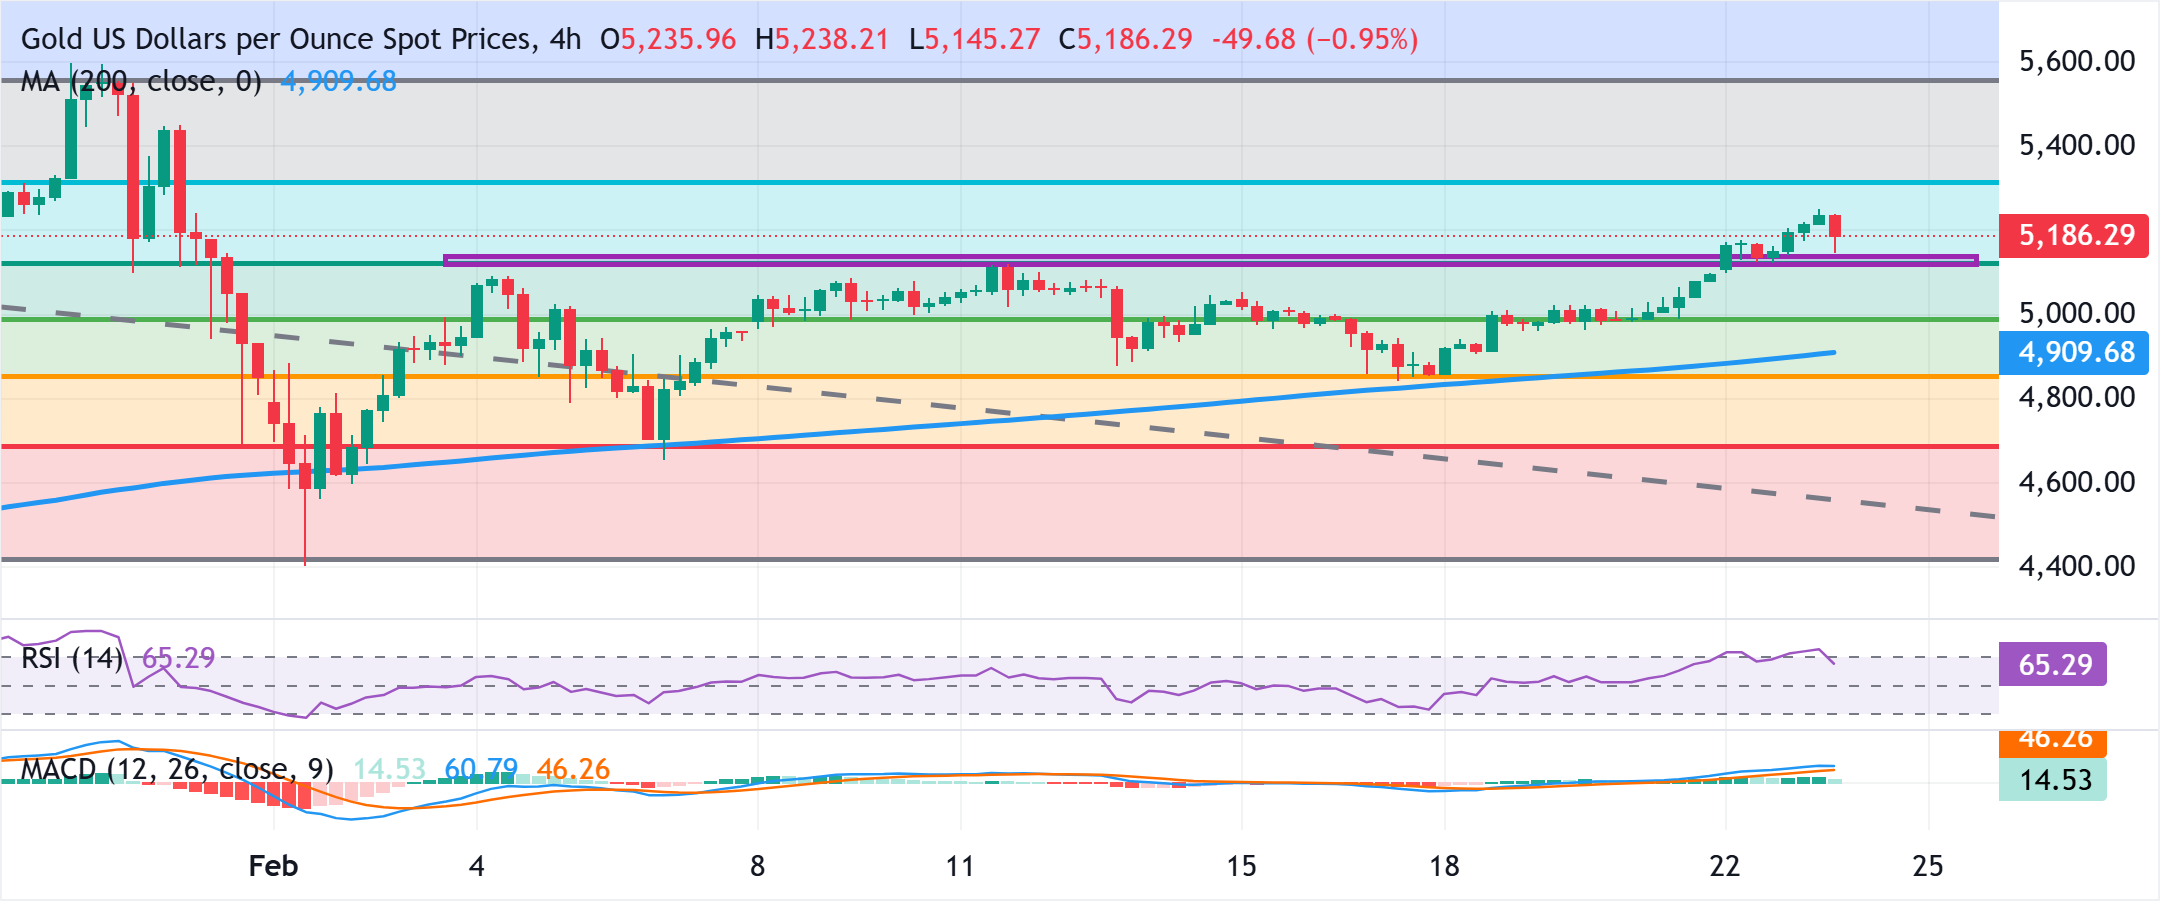
Gold bulls have the upper hand while above the $5,100 resistance breakpoint-turned-support
Against the backdrop of the recent rebounds from the 200-period Simple Moving Average (SMA), the overnight breakout above the $5,100-$5,110 horizontal barrier was seen as a fresh trigger for the XAU/USD bulls. The said area coincides with the 61.8% Fibonacci retracement level of a sharp corrective pullback from the all-time peak and should act as a key pivotal point.
The Moving Average Convergence Divergence (MACD) remains in positive territory but has cooled from recent peaks, hinting at moderating upside momentum. The Relative Strength Index (RSI) prints 65.78, easing from overbought and aligning with a slower ascent. Hence, the 78.6% Fibonacci retracement at $5,314.49 could now act as the important resistance to clear.
A 4-hour close above the latter would open further gains, which a failure to maintain traction above $5,123.17 would signal fading momentum and risk a deeper pullback toward the moving average. As long as the Gold holds above the rising 200-period SMA at $4,909.70, the path of least resistance stays higher.
(The technical analysis of this story was written with the help of an AI tool.)
Gold FAQs
Gold has played a key role in human’s history as it has been widely used as a store of value and medium of exchange. Currently, apart from its shine and usage for jewelry, the precious metal is widely seen as a safe-haven asset, meaning that it is considered a good investment during turbulent times. Gold is also widely seen as a hedge against inflation and against depreciating currencies as it doesn’t rely on any specific issuer or government.
Central banks are the biggest Gold holders. In their aim to support their currencies in turbulent times, central banks tend to diversify their reserves and buy Gold to improve the perceived strength of the economy and the currency. High Gold reserves can be a source of trust for a country’s solvency. Central banks added 1,136 tonnes of Gold worth around $70 billion to their reserves in 2022, according to data from the World Gold Council. This is the highest yearly purchase since records began. Central banks from emerging economies such as China, India and Turkey are quickly increasing their Gold reserves.
Gold has an inverse correlation with the US Dollar and US Treasuries, which are both major reserve and safe-haven assets. When the Dollar depreciates, Gold tends to rise, enabling investors and central banks to diversify their assets in turbulent times. Gold is also inversely correlated with risk assets. A rally in the stock market tends to weaken Gold price, while sell-offs in riskier markets tend to favor the precious metal.
The price can move due to a wide range of factors. Geopolitical instability or fears of a deep recession can quickly make Gold price escalate due to its safe-haven status. As a yield-less asset, Gold tends to rise with lower interest rates, while higher cost of money usually weighs down on the yellow metal. Still, most moves depend on how the US Dollar (USD) behaves as the asset is priced in dollars (XAU/USD). A strong Dollar tends to keep the price of Gold controlled, whereas a weaker Dollar is likely to push Gold prices up.
Nothing in this material constitutes investment advice, personal recommendation, investment research, an offer, or a solicitation to buy or sell any financial instrument. The content has been prepared without consideration of your individual investment objectives, financial situation, or needs, and should not be treated as such.
Past performance is not a reliable indicator of future performance and/or results. Forward-looking scenarios or forecasts are not a guarantee of future performance. Actual results may differ materially from those anticipated.
Mitrade makes no representation or warranty as to the accuracy or completeness of the information provided and accepts no liability for any loss arising from reliance on such information.
Recommended Articles


