

Gold holds above $5,170 as Iran tensions offset a firm USD
- Gold remains supported as US-Iran talks stall, with nuclear site demands raising geopolitical stakes.
- US Dollar firms near 98.00 on DXY, yet falling Treasury yields cushion bullion downside.
- Markets still price over 50 bps of easing by the Federal Reserve this year.
Gold price stays firm on Thursday during the North American session as geopolitical tensions remain elevated despite the beginning of the third round of talks between the US and Iran in Geneva. Also, solid data from the US kept bullion prices contained. At the time of writing, XAU/USD trades at $5,179, up 0.30%.
XAU/USD steadies despite strong US labor data; Middle East risks and trade uncertainty underpin Gold
Risk appetite takes a hit as investors evaluate Nvidia’s earnings, which failed to propel AI-related stocks and semiconductors higher. Discussions between Washington and Tehran seem to have reached a boiling point as the US demands that Iran destroy its three main nuclear sites in Fordow, Natanz and Isfahan. Alongside this, Tehran must hand over all the remaining enriched uranium to the US, according to The Wall Street Journal.
In the meantime, the US has sent additional military assets to Israel, exerting pressure on Iran to strike a deal.
Jobs data in the US delays Fed rate cuts
Additionally to tensions in the Middle East, uncertainty over US trade policies remain high. Tariffs for some countries will rise to 15% or higher, according to US Trade Representative Jamieson Greer.
Labor market data in the United States revealed that the number of Americans filing for unemployment benefits was below the estimated, as revealed by the Department of Labor in its Initial Jobless Claims report. Claims for the week ending on February 21 increased from 208K in the previous print to 212K, below forecasts of 215K.
Federal Reserve (Fed) Governor Stephen Miran maintained his dovish outlook, expecting 1% rate cuts this year. He stated that prices appear stable and does not see inflation as an issue in the US.
Money markets remain confident that the Federal Reserve will cut rates at least 52 basis points this year. Nevertheless, the first-rate cut was pushed back from June to July, as implied basis points of easing for the latter suggest a 26-bps rate reduction.
Given the backdrop, the US Dollar Index (DXY), which measures the performance of the buck’s value versus six currencies, surges 0.34% to 97.97. On the contrary, US Treasury yields, which correlate inversely to bullion’s value, in the 10-year Treasury note, are dropping three and a half basis points, down to 4.021%.
US PPI data eyed by traders
Ahead, traders' focus shifts to the US Producer Price Index (PPI) for January, which is expected to dip from 0.5% to 0.3% MoM, and on an annual basis, it is projected to drop from 3% to 2.6%.
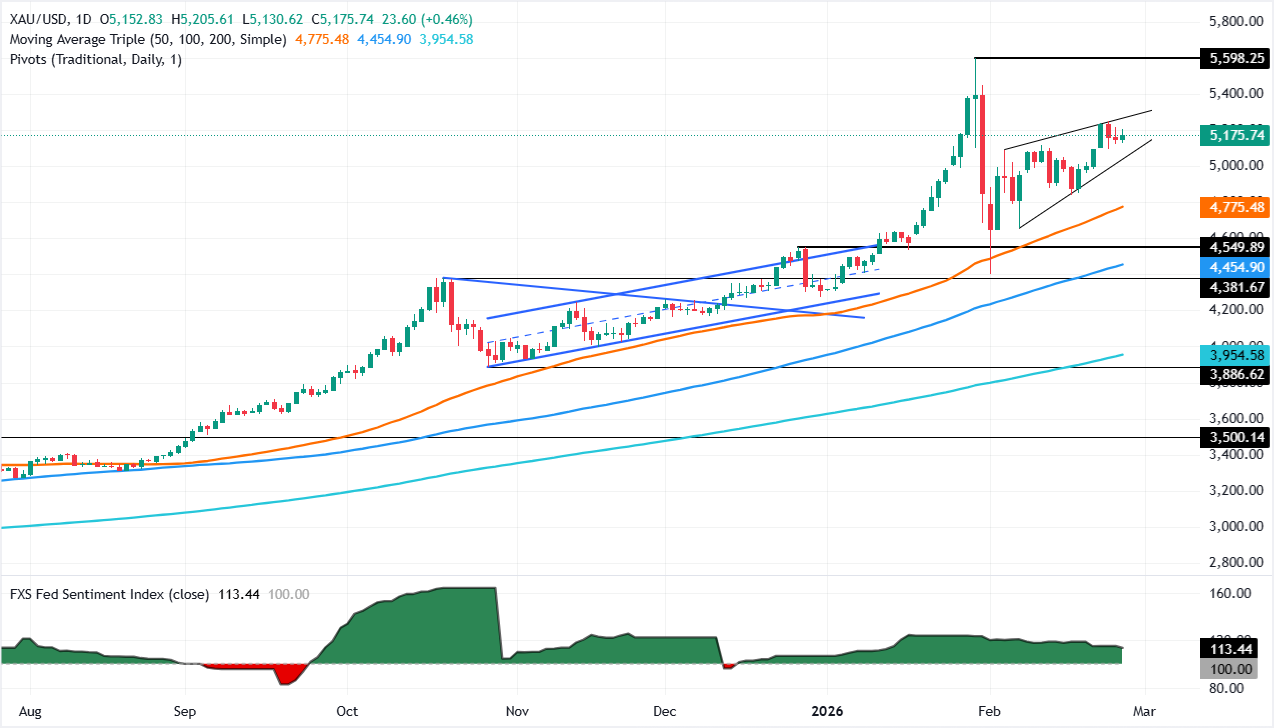
XAU/USD Technical outlook: Gold edges up but remains at risk below $5,250
Gold’s uptrend remains intact, even though the yellow metal has registered a lower high of $5,205, and the first support level lies above the February 25 daily low of $5,121. Momentum remains constructive as depicted by the Relative Strength Index (RSI), which remains above its neutral level, but buyers must clear $5,250 to remain hopeful of higher prices.
The first ceiling level would be $5,200, followed by the February 24 daily high of $5,249. Once cleared, the next stop would be $5,300 and the January 30 high at $5,451. On the bearish side, if bullion drops below $5,150 opens the door for a deeper retracement towards the 20-day Simple Moving Average (SMA) at $5,019 before testing $5,000.
Gold FAQs
Gold has played a key role in human’s history as it has been widely used as a store of value and medium of exchange. Currently, apart from its shine and usage for jewelry, the precious metal is widely seen as a safe-haven asset, meaning that it is considered a good investment during turbulent times. Gold is also widely seen as a hedge against inflation and against depreciating currencies as it doesn’t rely on any specific issuer or government.
Central banks are the biggest Gold holders. In their aim to support their currencies in turbulent times, central banks tend to diversify their reserves and buy Gold to improve the perceived strength of the economy and the currency. High Gold reserves can be a source of trust for a country’s solvency. Central banks added 1,136 tonnes of Gold worth around $70 billion to their reserves in 2022, according to data from the World Gold Council. This is the highest yearly purchase since records began. Central banks from emerging economies such as China, India and Turkey are quickly increasing their Gold reserves.
Gold has an inverse correlation with the US Dollar and US Treasuries, which are both major reserve and safe-haven assets. When the Dollar depreciates, Gold tends to rise, enabling investors and central banks to diversify their assets in turbulent times. Gold is also inversely correlated with risk assets. A rally in the stock market tends to weaken Gold price, while sell-offs in riskier markets tend to favor the precious metal.
The price can move due to a wide range of factors. Geopolitical instability or fears of a deep recession can quickly make Gold price escalate due to its safe-haven status. As a yield-less asset, Gold tends to rise with lower interest rates, while higher cost of money usually weighs down on the yellow metal. Still, most moves depend on how the US Dollar (USD) behaves as the asset is priced in dollars (XAU/USD). A strong Dollar tends to keep the price of Gold controlled, whereas a weaker Dollar is likely to push Gold prices up.
Nothing in this material constitutes investment advice, personal recommendation, investment research, an offer, or a solicitation to buy or sell any financial instrument. The content has been prepared without consideration of your individual investment objectives, financial situation, or needs, and should not be treated as such.
Past performance is not a reliable indicator of future performance and/or results. Forward-looking scenarios or forecasts are not a guarantee of future performance. Actual results may differ materially from those anticipated.
Mitrade makes no representation or warranty as to the accuracy or completeness of the information provided and accepts no liability for any loss arising from reliance on such information.
Recommended Articles


