



Gold Price Forecast: Will Gold Keep Falling After Dropping Below $4,300 as US-Iran Conflict Drives Up Oil Prices?
TradingKey - As of the Asian trading session on September 2, gold prices (XAUUSD) fell below $4,300 intraday to a low of $4,282.45, with the latest price hovering around $4,320, down nearly 9% cumulatively from last week's peak near $4,700. Recently, a clear escalation in the U.S.-Iran military conflict drove up international oil prices (USOIL) sharply. Meanwhile, rising expectations of Federal Reserve rate hikes, a strengthening U.S. dollar, and rapidly rising U.S. Treasury yields have kept gold prices under continuous downward pressure.
Why Are Gold Prices Continuing to Fall? US-Iran Conflict Drives Up Oil, Fed Rate Hike Expectations Heat Up Further
From a fundamental perspective, the primary pressure driving the recent continuous decline in gold remains shifted expectations for U.S. interest rates. After Fed Chair Warsh delivered hawkish signals at the Jackson Hole meeting last week, the market began re-evaluating the likelihood of a rate hike in September, while the further escalation of the U.S.-Iran conflict over the past two days has reinforced market fears of a resurgence in inflation by pushing up energy prices.
The U.S.-Iran situation deteriorated noticeably over the past 24 hours. The U.S. launched a new round of airstrikes against Iran, targeting air defense facilities, radar systems, naval assets, and minelaying capabilities, following which Iran retaliated against U.S.-related targets in Jordan, Bahrain, and Iraq. Previously, two supertankers carrying Saudi crude oil were attacked while exiting the Strait of Hormuz, heightening market concerns over the security of Middle East crude oil transport. WTI crude rose 5.09% on Tuesday to close at $90.69, while Brent crude advanced 4.98% to close at $95.20, both reaching their highest closing levels in about five weeks; oil prices continued to rise during Wednesday's Asian trading session.
Meanwhile, the 10-year U.S. Treasury yield briefly rose to around 4.81% during Wednesday's Asian session, reaching its highest level since November 2023. Because gold pays no interest, the rapid rise in U.S. Treasury yields increases the opportunity cost of holding gold. At the same time, the U.S. dollar remained strong, putting further pressure on dollar-denominated gold.
Notably, crude oil transit through the Strait of Hormuz has not ground to a complete halt. U.S. Energy Secretary Chris Wright stated that approximately 17 million barrels of crude oil passed through the Strait of Hormuz on Monday, the highest level since shipments fell due to the war in Iran. If this trend can be sustained, market concerns over severe supply disruptions may ease, limiting further gains in international oil prices.
Looking ahead, market focus will gradually shift to U.S. employment data. U.S. August ADP employment data will be released on Wednesday, while Friday's nonfarm payrolls report carries even greater weight. If employment remains resilient, against the current backdrop of high oil prices and rising inflation risks, the market may further raise expectations for Fed rate hikes, putting pressure on gold; conversely, if employment proves significantly weaker than expected, U.S. Treasury yields and the dollar may pull back, providing gold with an opportunity for a temporary rebound.
Gold Price Technical Analysis
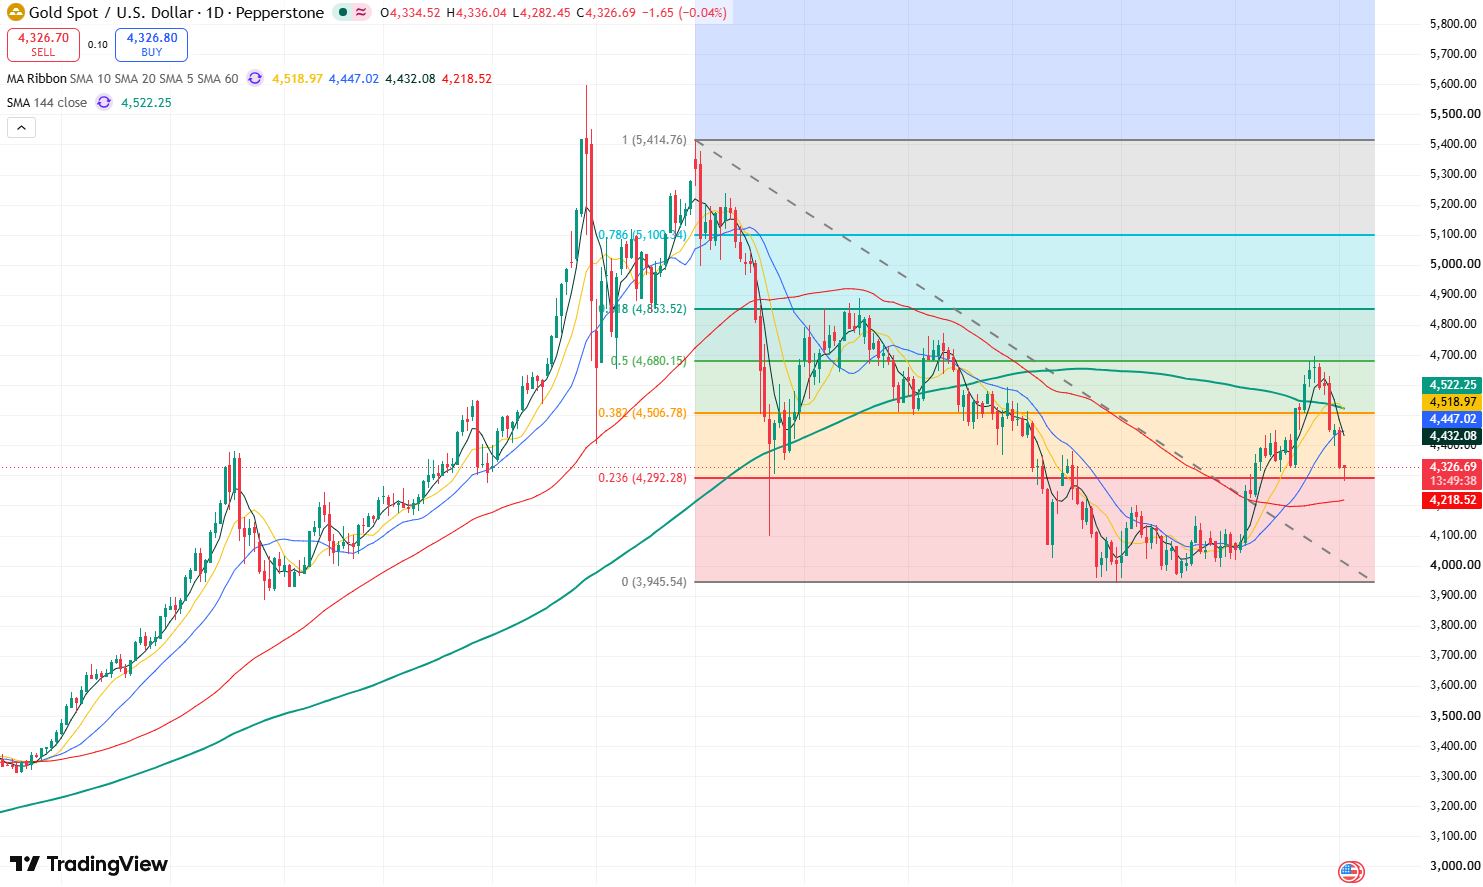
Gold price daily chart, Source: TradingView
Looking at the daily chart of gold prices, gold once approached $4,700 last week before continuing to pull back. Following Warsh's hawkish speech, gold fell successively below $4,600 and $4,500, and further broke below $4,400 and $4,300 this week, indicating that market sentiment for gold is noticeably weak.
Currently, gold prices dipped intraday today to the 0.236 Fibonacci retracement level at $4,292, receiving some short-term support to rebound. However, attention should be paid to whether today's closing price can hold firmly above this level. If it breaks below, gold prices may open up room for a deeper correction, with the primary downside target testing the $4,200 mark.
Conversely, if today's closing price holds firmly above $4,292, gold prices will see a short-term technical rebound, with the primary upside target testing $4,400-$4,460. If it breaks above $4,460, gold prices may test the $4,500 mark.
Nothing in this material constitutes investment advice, personal recommendation, investment research, an offer, or a solicitation to buy or sell any financial instrument. The content has been prepared without consideration of your individual investment objectives, financial situation, or needs, and should not be treated as such.
Past performance is not a reliable indicator of future performance and/or results. Forward-looking scenarios or forecasts are not a guarantee of future performance. Actual results may differ materially from those anticipated.
Mitrade makes no representation or warranty as to the accuracy or completeness of the information provided and accepts no liability for any loss arising from reliance on such information.
Recommended Articles


