CFDs are complex instruments and come with a high risk of losing money rapidly due to leverage. 74% of retail investor accounts lose money when trading CFDs with this provider. You should consider whether you understand how CFDs work and whether you can afford to take the high risk of losing your money.

Cardano Price Forecast: ADA slips below $0.37 as holders offload tokens

Source Fxstreet
  • Cardano price trades in the red on Tuesday after reaching a two-month low last week.
  • Santiment data indicate that ADA holders are offloading tokens, adding to growing sell-side pressure.
  • Derivatives data and technical indicators suggest further downside, with rising short positions and weakening momentum.

Cardano (ADA) price trades below $0.37 at the time of writing on Tuesday after hitting a two-month low in the previous week. The bearish sentiment is further strengthened by holders offloading ADA, increasing selling pressure. Meanwhile, rising short bets and weakening momentum further indicate downside pressure for Cardano. 

Cardano whales offload 90 million tokens 

Santiment’s Supply Distribution indicates that the number of Cardano’s large-wallet holders is declining, suggesting a bearish outlook.

The metric indicates that the whales holding between 100,000 and 1 million (red line), 1 million and 10 million (yellow line), and 10 million and 100 million (blue line) have shed a total of 90 million Cardano tokens from Saturday to Tuesday, thereby increasing selling pressure.

Cardano supply distribution chart. Source: Santiment

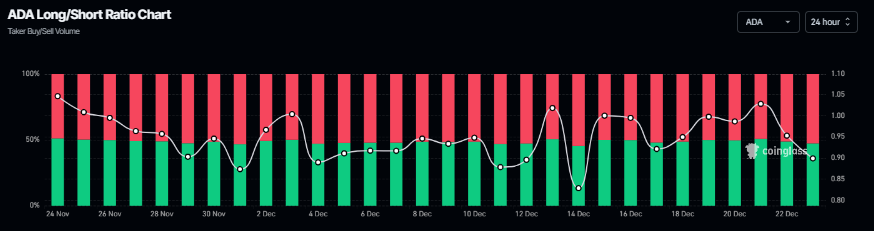
On the derivatives side, Coinglass’s long-to-short ratio for ADA reads 0.89 on Tuesday. The ratio below one suggests bearish sentiment in the market, as more traders are betting on the ADA price to fall.

Cardano long-to-short ratio chart. Source: Coinglass

Cardano Price Forecast: ADA bears aiming for levels below $0.27

Cardano price was rejected from the upper trendline of the falling wedge pattern (formed by connecting multiple highs and lows with two trendlines since mid-October) on December 9 and declined 27% in the next 9 days, reaching a two-month low of $0.34 on Friday. ADA recovered slightly but failed to sustain the rebound and continued its correction. At the time of writing on Tuesday, ADA is trading down, around $0.36.

If ADA continues its downward trend, it could extend the fall toward the October 10 low of $0.27.

The Relative Strength Index (RSI) on the daily chart is at 37, pointing downward toward the oversold level, indicating strong bearish momentum. Additionally, the Moving Average Convergence Divergence (MACD) indicator showed a bearish crossover on Wednesday, which remains intact, further supporting the negative outlook.

ADA/USDT daily chart 

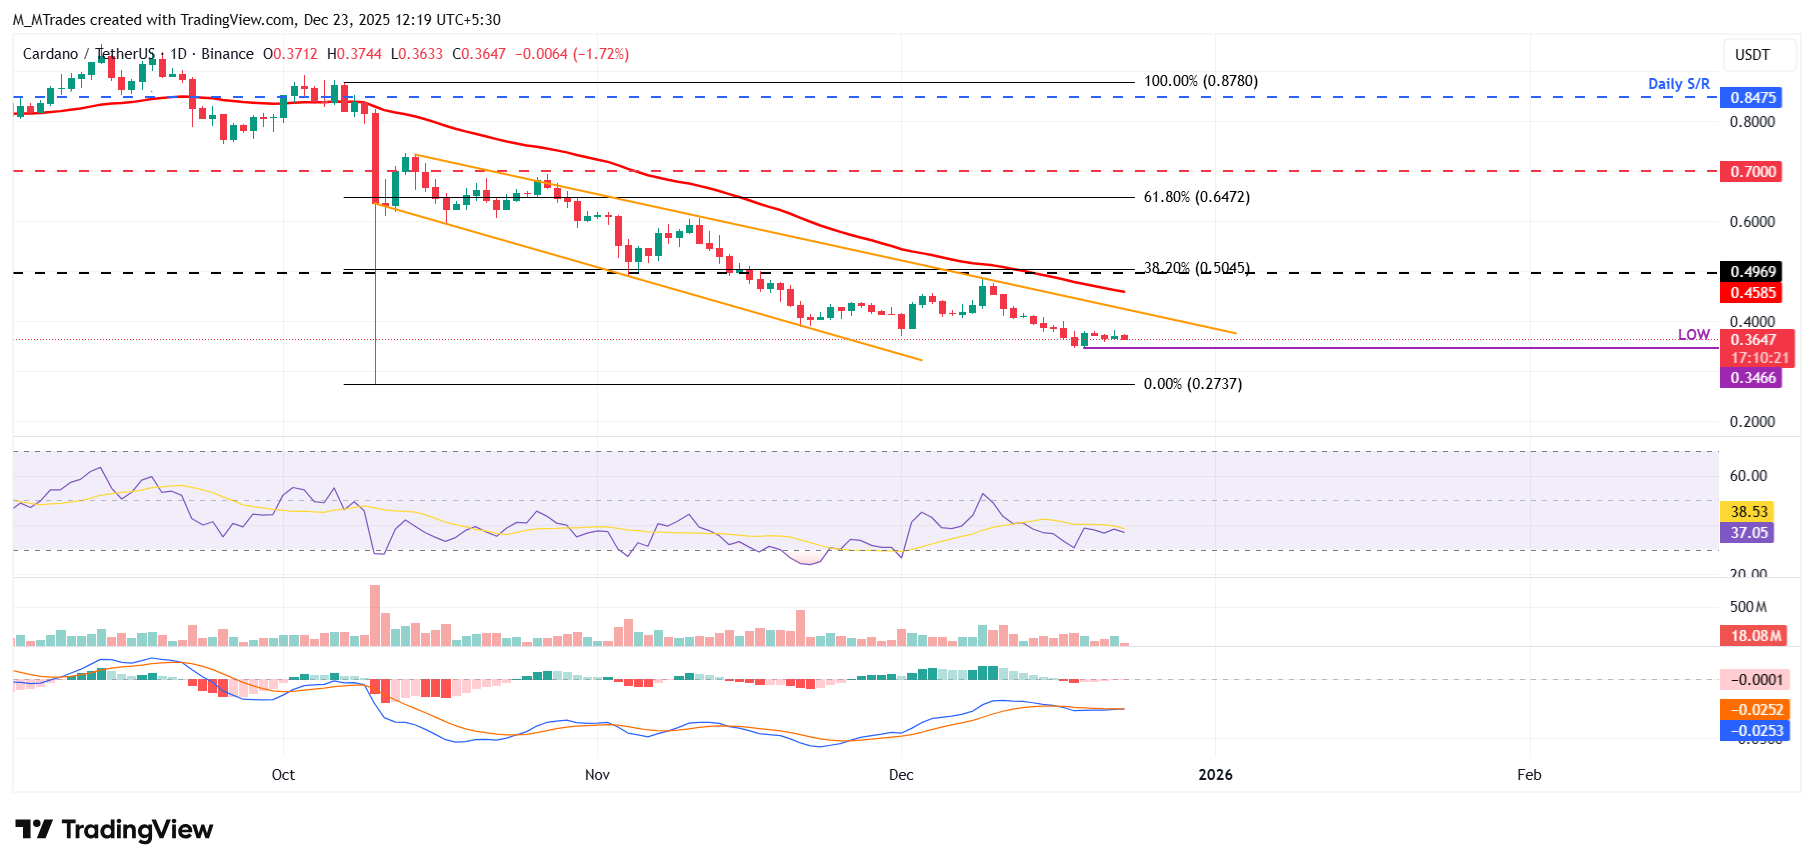
However, if ADA recovers, it could extend the advance toward the 50-day EMA at $0.45.

Disclaimer: The content available on Mitrade Insights is provided for informational and marketing purposes only. It has not been prepared in accordance with legal requirements designed to promote the independence of investment research and is not subject to any prohibition on dealing ahead of the dissemination of investment research
Nothing in this material constitutes investment advice, personal recommendation, investment research, an offer, or a solicitation to buy or sell any financial instrument. The content has been prepared without consideration of your individual investment objectives, financial situation, or needs, and should not be treated as such.
Past performance is not a reliable indicator of future performance and/or results. Forward-looking scenarios or forecasts are not a guarantee of future performance. Actual results may differ materially from those anticipated.
Mitrade makes no representation or warranty as to the accuracy or completeness of the information provided and accepts no liability for any loss arising from reliance on such information.
placeholder
Bitcoin Open Interest Plunges: Derivatives 'Flush Out' May Signal Major BottomBitcoin open interest has seen its sharpest 30-day drop of the cycle, with 1.3 million BTC in futures wiped out as price falls over 30% from $126,000 — a deleveraging that analyst “Darkfost” says could mark a bottom if BTC can later reclaim the $90,000–$96,000 zone and revive the bull trend.
Author  Mitrade
Nov 24, 2025
Bitcoin open interest has seen its sharpest 30-day drop of the cycle, with 1.3 million BTC in futures wiped out as price falls over 30% from $126,000 — a deleveraging that analyst “Darkfost” says could mark a bottom if BTC can later reclaim the $90,000–$96,000 zone and revive the bull trend.
placeholder
Pi Network Price Forecast: Whale Accumulation and Technical Confluence Put PI on Breakout WatchPi Network trades higher near a key $0.247 resistance zone, with whale accumulation, a 50-day EMA/Fibonacci confluence and bullish RSI–MACD signals all putting PI on breakout watch as long as weekly support at $0.221 holds.
Author  Mitrade
Nov 24, 2025
Pi Network trades higher near a key $0.247 resistance zone, with whale accumulation, a 50-day EMA/Fibonacci confluence and bullish RSI–MACD signals all putting PI on breakout watch as long as weekly support at $0.221 holds.
placeholder
Pi Network Price Forecast: PI falls as December token unlock overshadows gaming partnershipPi Network (PI) is down 4% by press time on Friday, after three days of an uptrend fueled by the CiDi Games partnership announcement on Wednesday.
Author  FXStreet
Nov 28, 2025
Pi Network (PI) is down 4% by press time on Friday, after three days of an uptrend fueled by the CiDi Games partnership announcement on Wednesday.
placeholder
Silver price today: Silver rises, according to FXStreet dataSilver prices (XAG/USD) rose on Monday, according to FXStreet data. Silver trades at $81.78 per troy ounce, up 5.54% from the $77.48 it cost on Friday.
Author  FXStreet
Feb 09, Mon
Silver prices (XAG/USD) rose on Monday, according to FXStreet data. Silver trades at $81.78 per troy ounce, up 5.54% from the $77.48 it cost on Friday.
placeholder
WTI drops below $64.00, Middle East tensions in focusWest Texas Intermediate (WTI), the US crude oil benchmark, is trading around $63.80 during the early Asian trading hours on Tuesday. The WTI price falls as concerns about supply disruptions in the Middle East have faded.
Author  FXStreet
Feb 10, Tue
West Texas Intermediate (WTI), the US crude oil benchmark, is trading around $63.80 during the early Asian trading hours on Tuesday. The WTI price falls as concerns about supply disruptions in the Middle East have faded.
Related Instrument
goTop
quote