CFDs are complex instruments and come with a high risk of losing money rapidly due to leverage. 74% of retail investor accounts lose money when trading CFDs with this provider. You should consider whether you understand how CFDs work and whether you can afford to take the high risk of losing your money.

Cosmos Price Forecast: ATOM rebounds on rising on-chain, retail demand

Source Fxstreet
  • ATOM extends recovery on Tuesday after a bullish pinbar candlestick formed near the 20-day EMA the previous day.
  • Data shows the total chain value on Cosmos is $1.24 billion, which is consistent with 99.5% of ATOM.
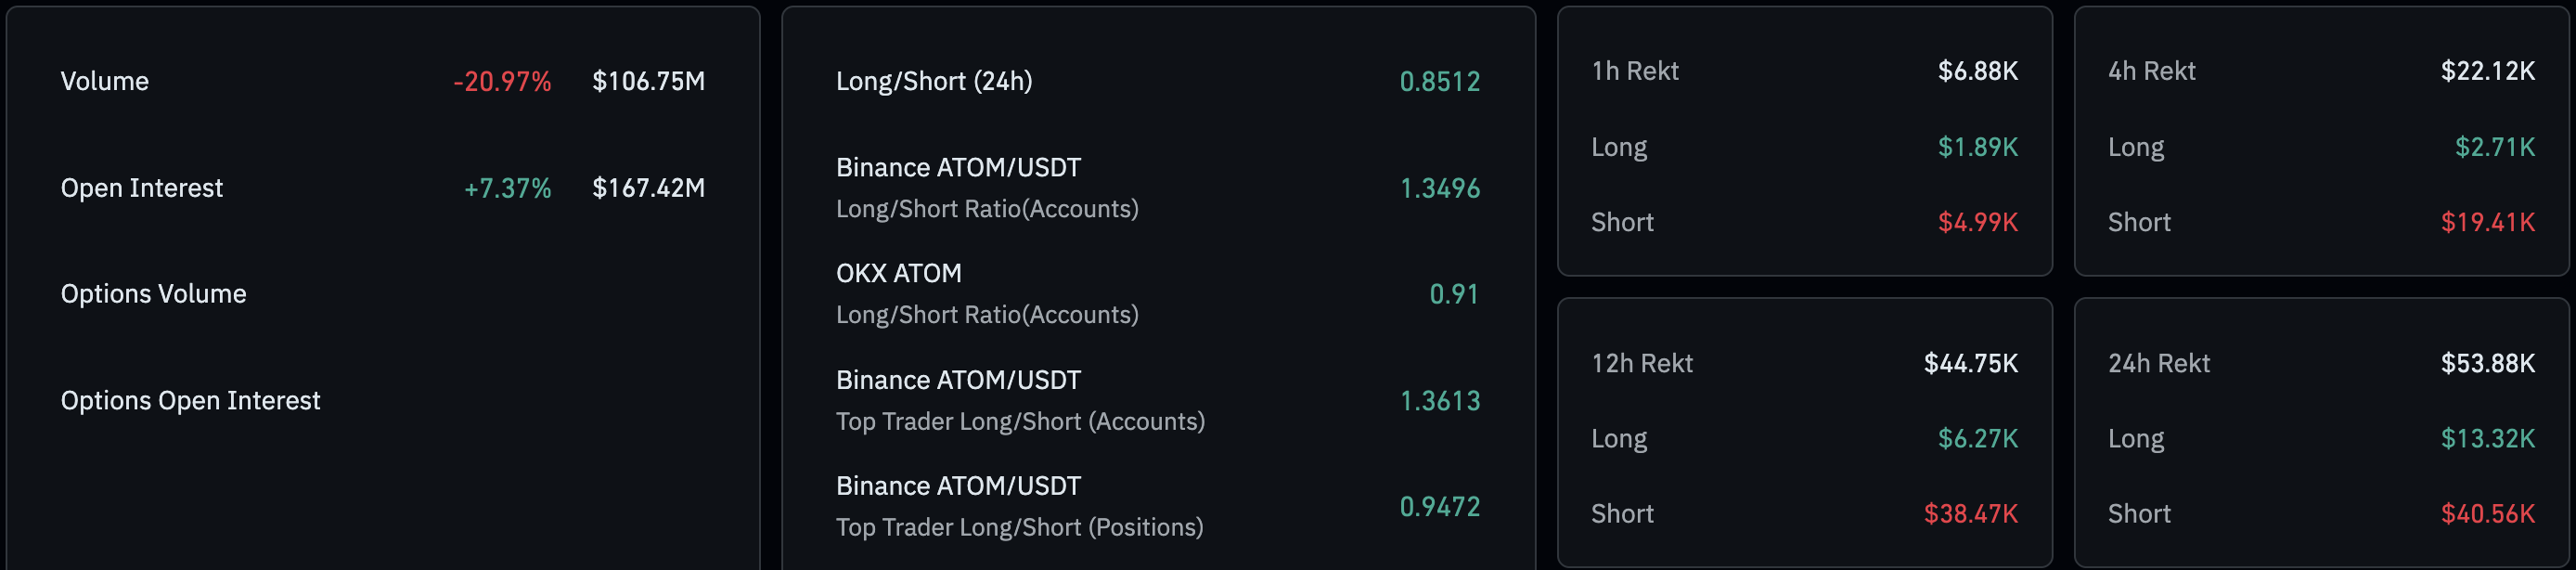
  • Derivatives data suggests renewed interest among retail traders as ATOM futures Open Interest rises.

Cosmos (ATOM) trades near $2.50 at the time of writing on Tuesday, holding above the 20-day Exponential Moving Average (EMA). A steady rise in capital deposited on the network and ATOM futures Open Interest suggests that on-chain demand is consistently increasing with retail activity. The technical outlook for ATOM remains mixed, as indicators suggest a downside bias.

Cosmos regains on-chain, retail demand

According to Mintscan data, the Total Chain Value of Cosmos stands at $1.24 billion on Monday, up from $938.50 million on December 31. Over 99% of the value is derived from ATOM, while Inter-Blockchain Communication (IBC) accounts for $13.71 million of outflow from the blockchain.

Cosmos on-chain data. Source: MintScan

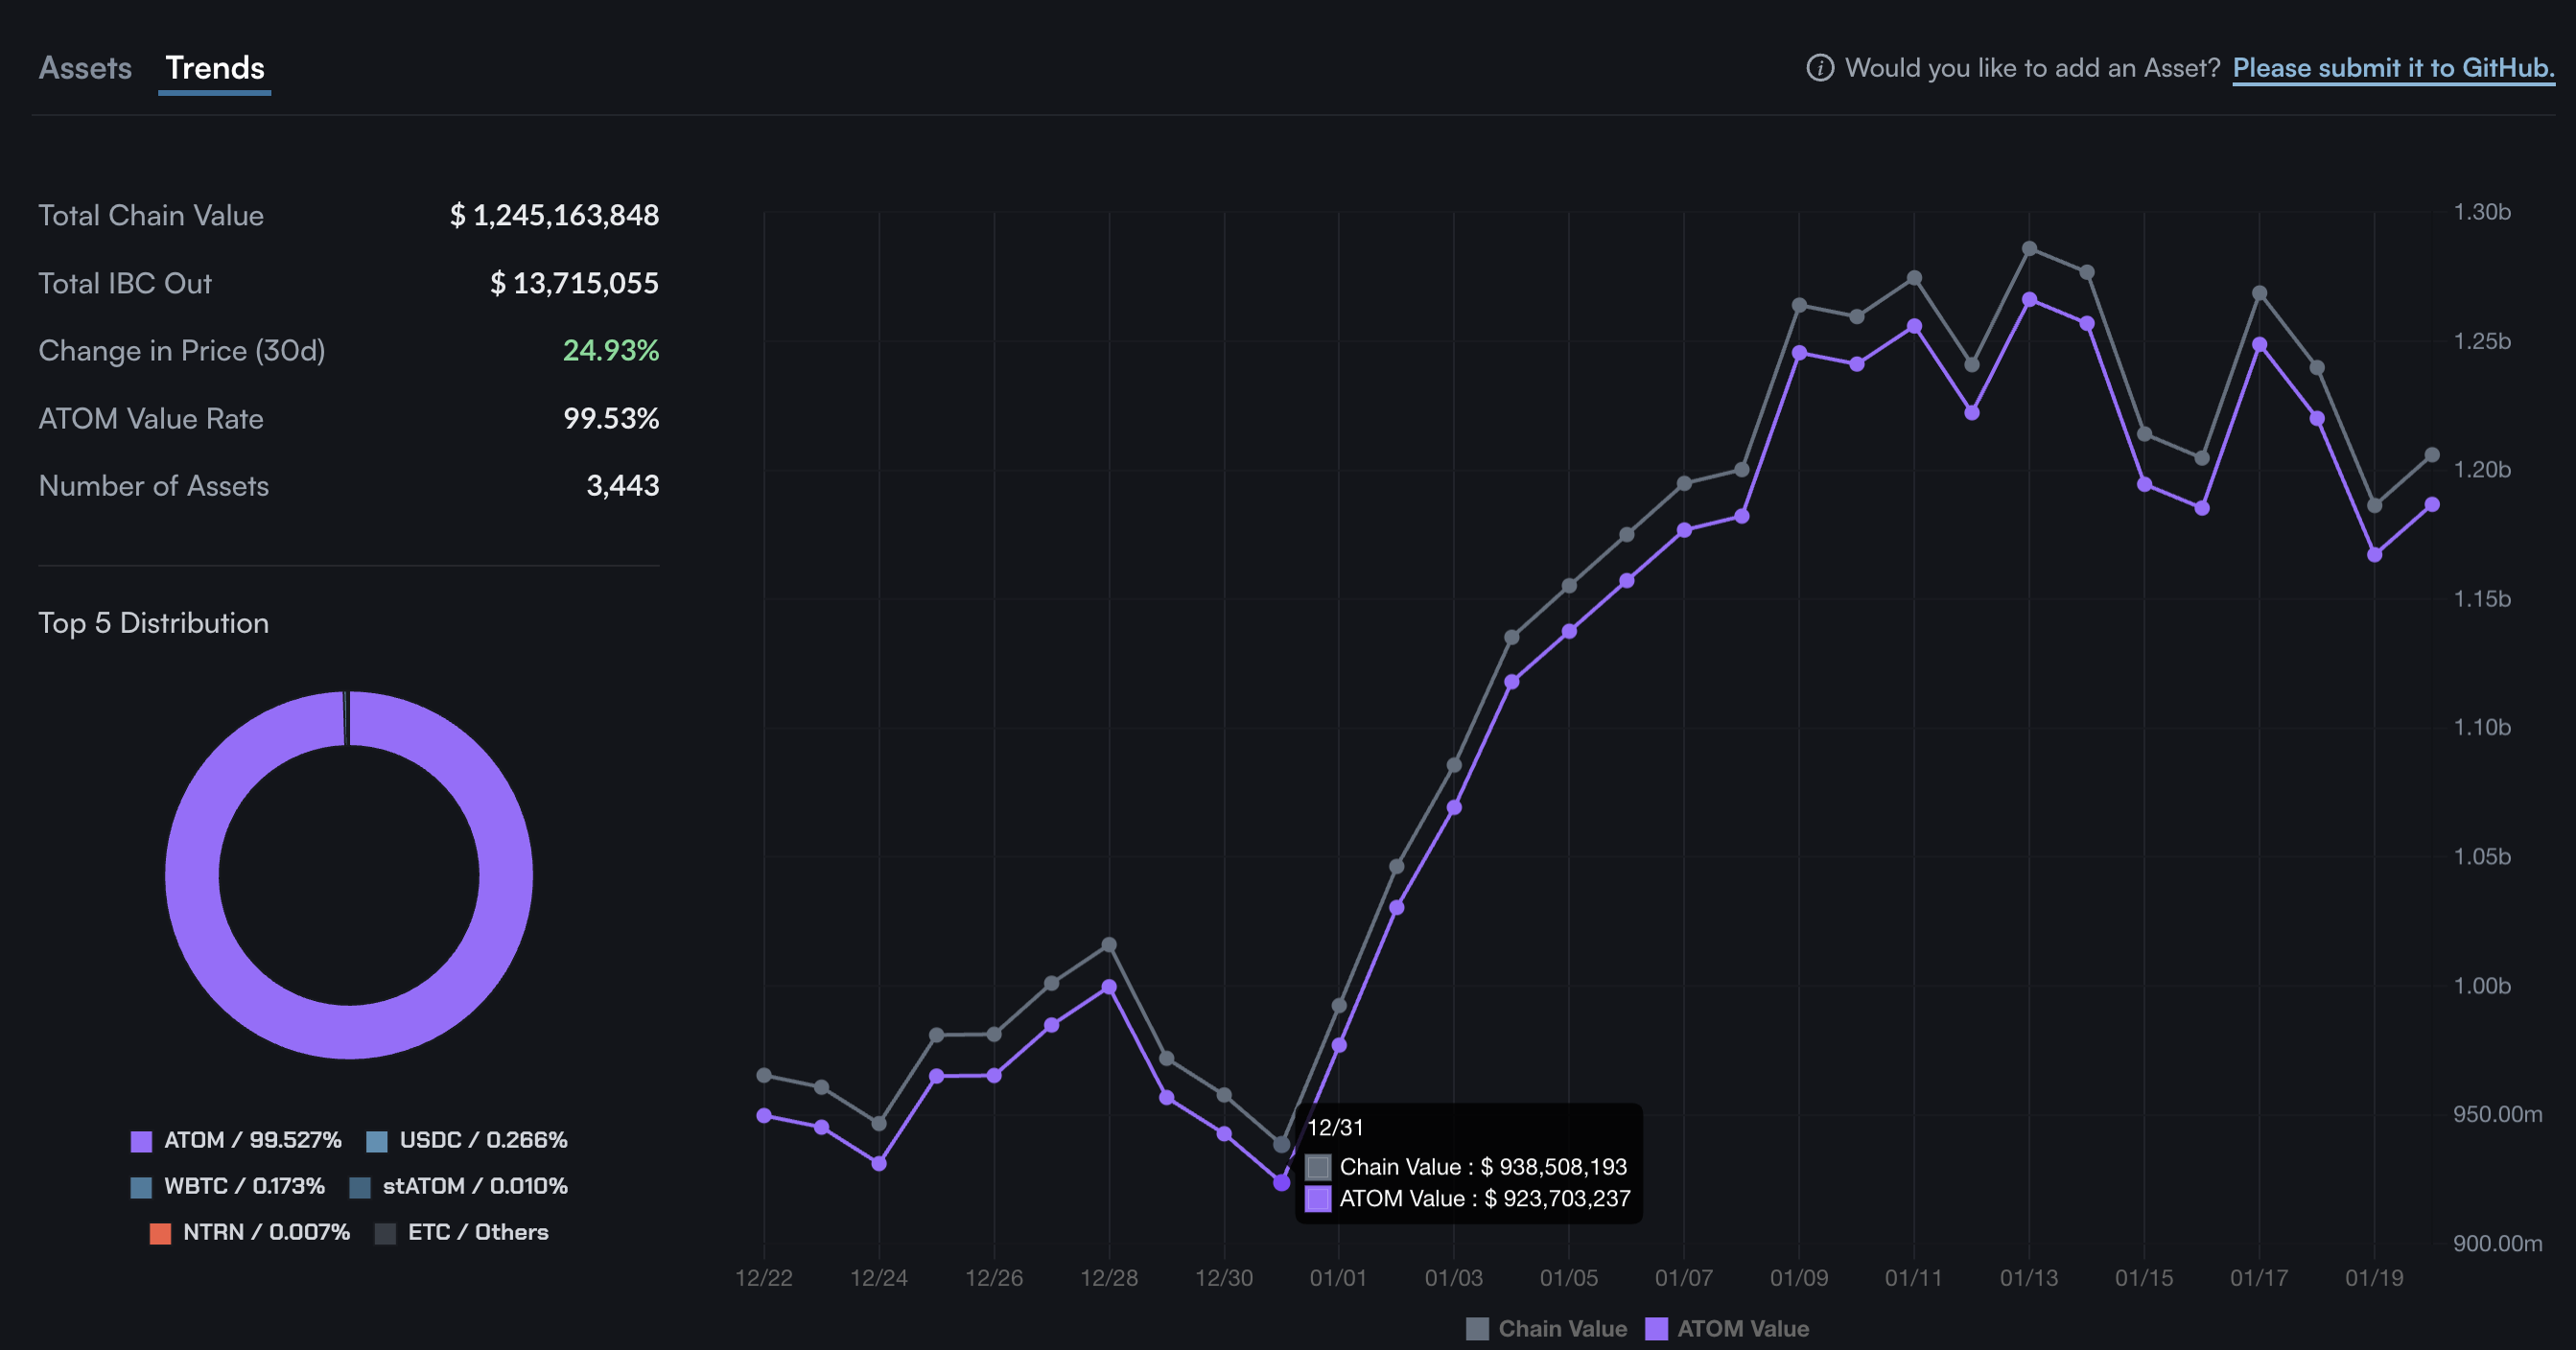
On the derivatives side, CoinGlass data shows ATOM futures Open Interest (OI) is up 7.37% over the last 24 hours, to $167.42 million, indicating a capital influx consistent with renewed on-chain demand. A steady rise in chain value and OI could shift the bias upside for ATOM.

ATOM derivatives data. Source: CoinGlass

Technical outlook: Will Cosmos extend recovery?

Cosmos holds above the 20-day EMA at $2.43 and the 50-day EMA at $2.40, with both averages edging higher and supporting the short-term bid. Still, ATOM remains well beneath a falling 200-day EMA at $3.24, reflecting a broader downtrend.

The Moving Average Convergence Divergence (MACD) indicator crossed below the red signal line on the daily chart, and the histogram is extending to the downside, suggesting a rise in bearish momentum. If the histogram returns to positive, it would improve bullish conviction, while sustained weakness could reinforce the downside bias.

The Relative Strength Index (RSI) is at 57 on the same timeframe, confirming a slightly bullish momentum. 

The October 11 low at $2.85 could serve as an immediate target for a potential rebound in ATOM as a support-turned-resistance.

ATOM/USDT daily price chart.

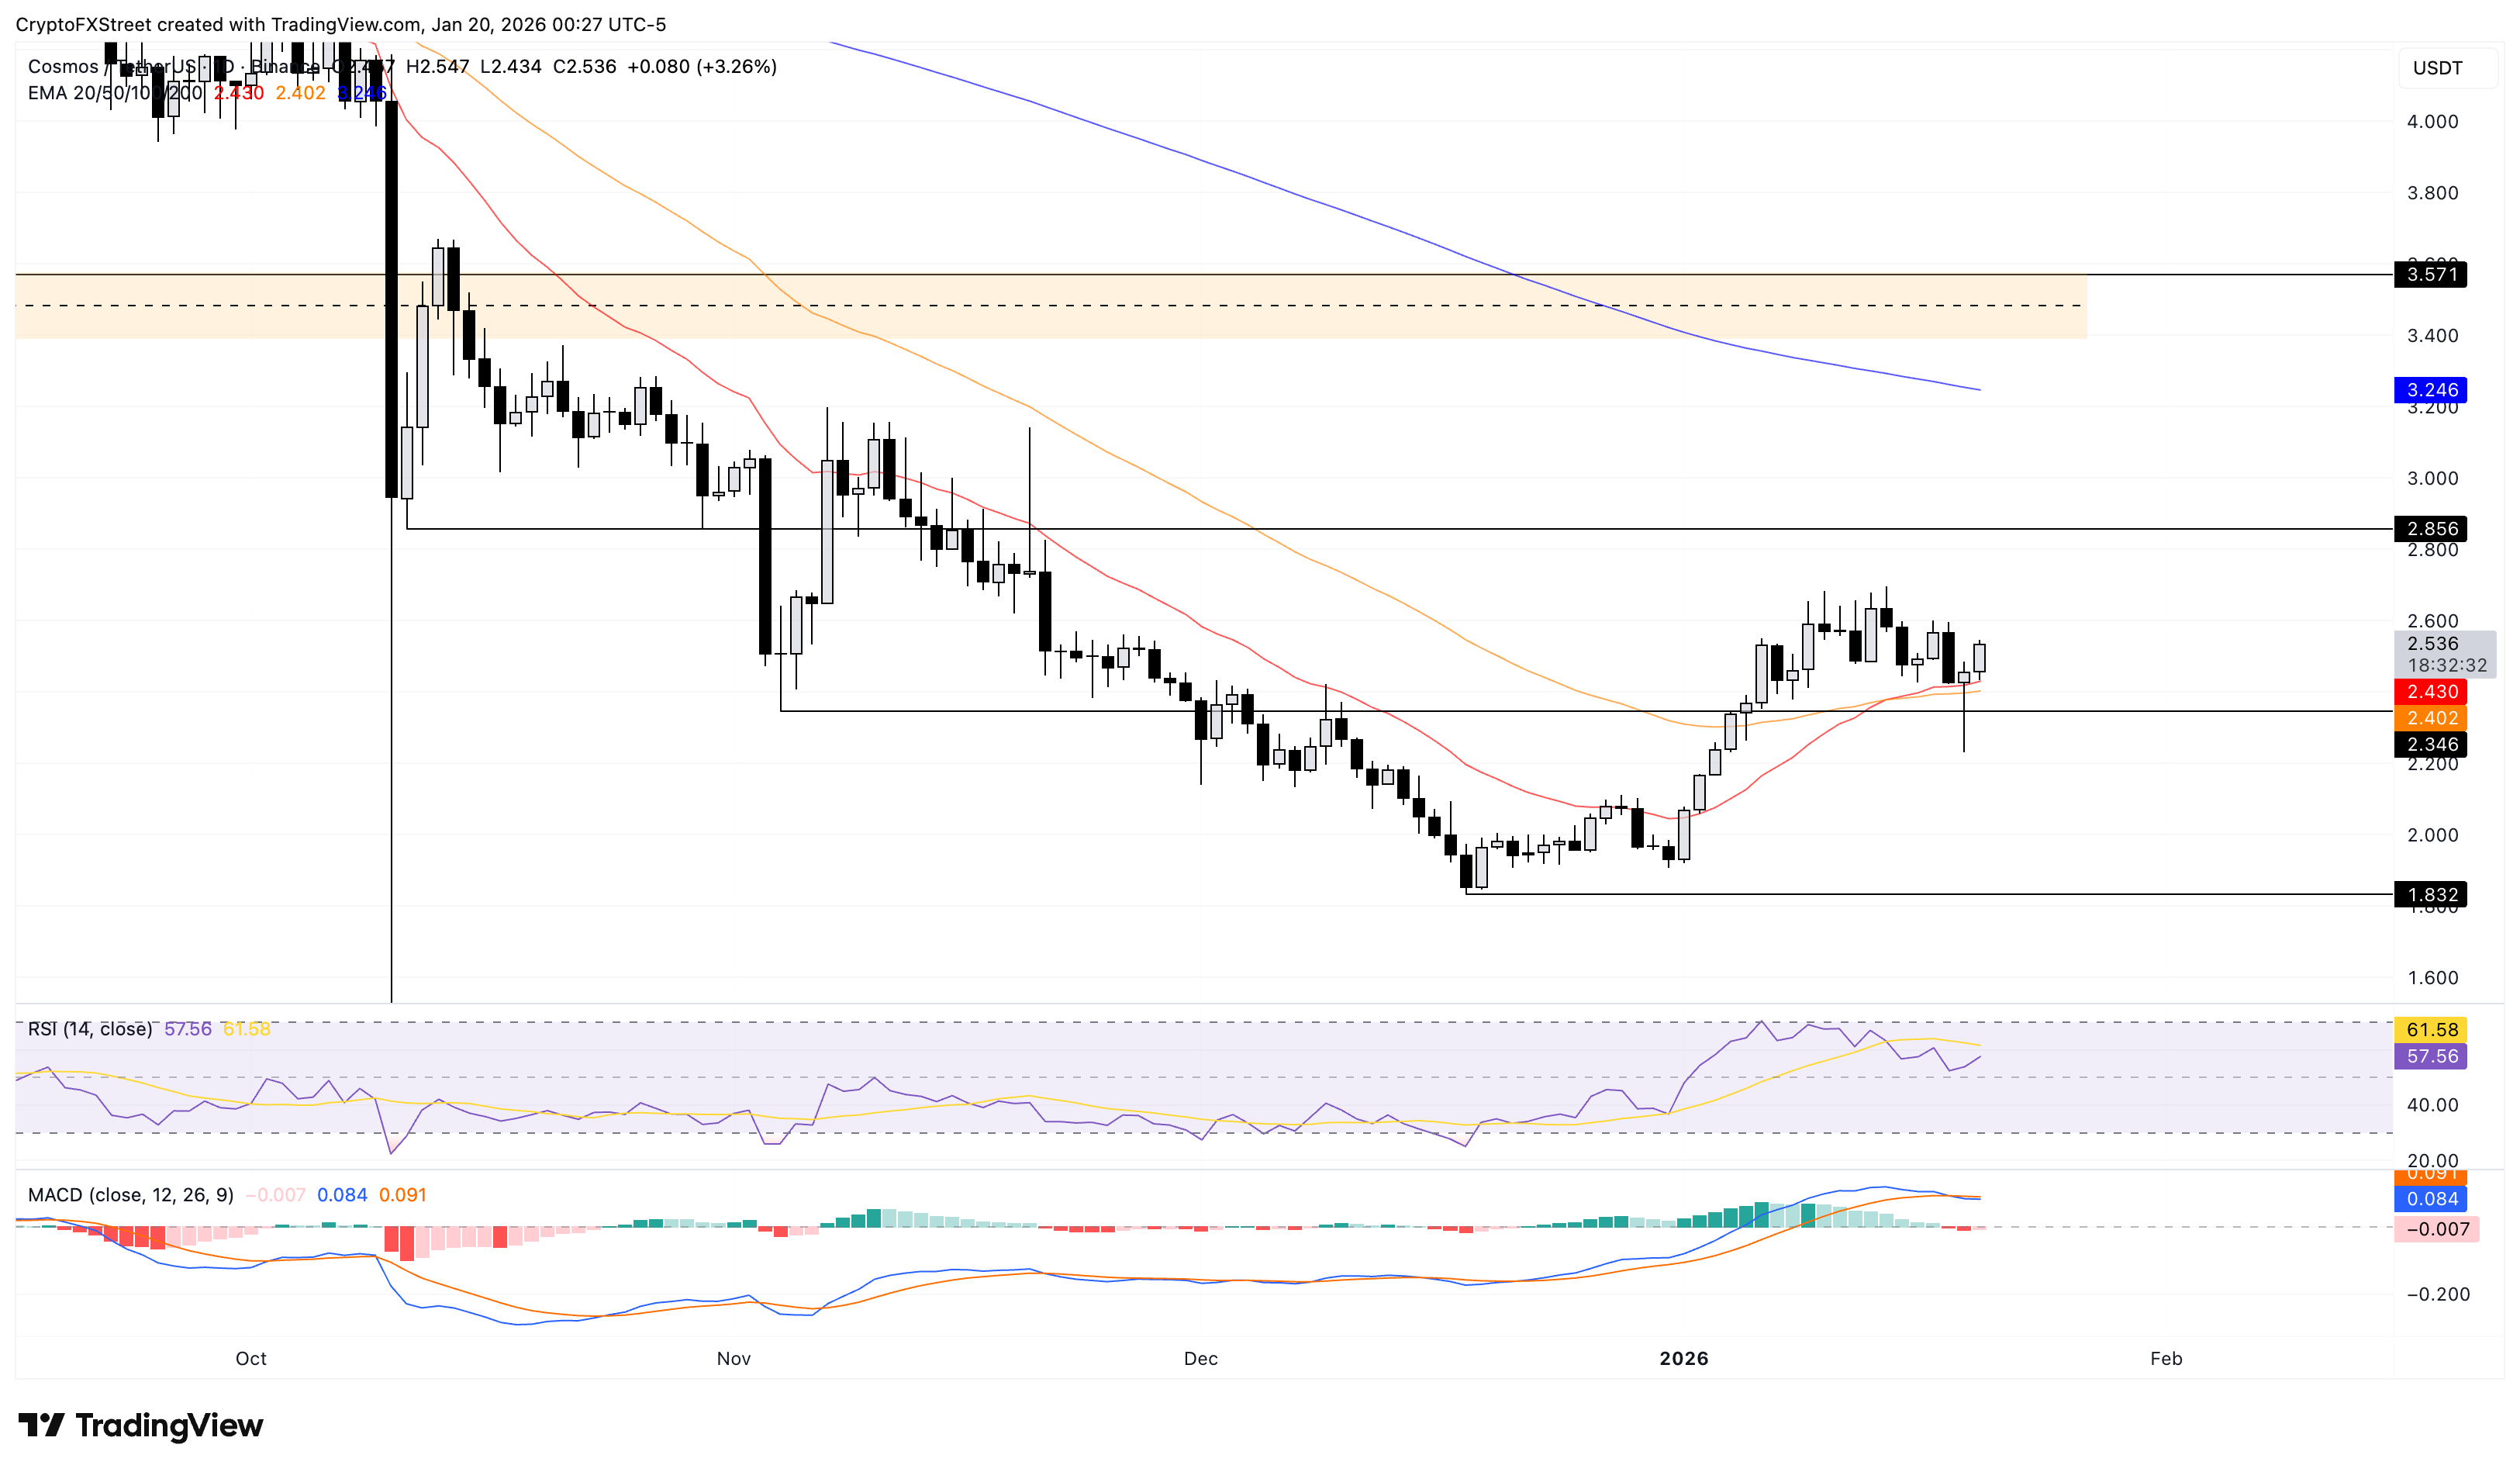
On the contrary, if ATOM marks a daily close below the November 4 low at $2.34, it would likely open the door to the $2.00 psychological support level.

(The technical analysis of this story was written with the help of an AI tool.)

Disclaimer: The content available on Mitrade Insights is provided for informational and marketing purposes only. It has not been prepared in accordance with legal requirements designed to promote the independence of investment research and is not subject to any prohibition on dealing ahead of the dissemination of investment research
Nothing in this material constitutes investment advice, personal recommendation, investment research, an offer, or a solicitation to buy or sell any financial instrument. The content has been prepared without consideration of your individual investment objectives, financial situation, or needs, and should not be treated as such.
Past performance is not a reliable indicator of future performance and/or results. Forward-looking scenarios or forecasts are not a guarantee of future performance. Actual results may differ materially from those anticipated.
Mitrade makes no representation or warranty as to the accuracy or completeness of the information provided and accepts no liability for any loss arising from reliance on such information.
placeholder
Bitcoin Open Interest Plunges: Derivatives 'Flush Out' May Signal Major BottomBitcoin open interest has seen its sharpest 30-day drop of the cycle, with 1.3 million BTC in futures wiped out as price falls over 30% from $126,000 — a deleveraging that analyst “Darkfost” says could mark a bottom if BTC can later reclaim the $90,000–$96,000 zone and revive the bull trend.
Author  Mitrade
Nov 24, 2025
Bitcoin open interest has seen its sharpest 30-day drop of the cycle, with 1.3 million BTC in futures wiped out as price falls over 30% from $126,000 — a deleveraging that analyst “Darkfost” says could mark a bottom if BTC can later reclaim the $90,000–$96,000 zone and revive the bull trend.
placeholder
Pi Network Price Forecast: Whale Accumulation and Technical Confluence Put PI on Breakout WatchPi Network trades higher near a key $0.247 resistance zone, with whale accumulation, a 50-day EMA/Fibonacci confluence and bullish RSI–MACD signals all putting PI on breakout watch as long as weekly support at $0.221 holds.
Author  Mitrade
Nov 24, 2025
Pi Network trades higher near a key $0.247 resistance zone, with whale accumulation, a 50-day EMA/Fibonacci confluence and bullish RSI–MACD signals all putting PI on breakout watch as long as weekly support at $0.221 holds.
placeholder
Pi Network Price Forecast: PI falls as December token unlock overshadows gaming partnershipPi Network (PI) is down 4% by press time on Friday, after three days of an uptrend fueled by the CiDi Games partnership announcement on Wednesday.
Author  FXStreet
Nov 28, 2025
Pi Network (PI) is down 4% by press time on Friday, after three days of an uptrend fueled by the CiDi Games partnership announcement on Wednesday.
placeholder
GBP/USD Price Forecast: Softens below 1.3500 but retains positive technical outlookThe GBP/USD pair loses momentum near 1.3485 during the early European session on Monday, pressured by renewed US Dollar (USD) demand. The potential downside for a major pair might be limited, as the Bank of England (BoE) guided that monetary policy will remain on a gradual downward path.
Author  FXStreet
Dec 29, 2025
The GBP/USD pair loses momentum near 1.3485 during the early European session on Monday, pressured by renewed US Dollar (USD) demand. The potential downside for a major pair might be limited, as the Bank of England (BoE) guided that monetary policy will remain on a gradual downward path.
placeholder
WTI drops below $64.00, Middle East tensions in focusWest Texas Intermediate (WTI), the US crude oil benchmark, is trading around $63.80 during the early Asian trading hours on Tuesday. The WTI price falls as concerns about supply disruptions in the Middle East have faded.
Author  FXStreet
Feb 10, Tue
West Texas Intermediate (WTI), the US crude oil benchmark, is trading around $63.80 during the early Asian trading hours on Tuesday. The WTI price falls as concerns about supply disruptions in the Middle East have faded.
Related Instrument
goTop
quote