CFDs are complex instruments and come with a high risk of losing money rapidly due to leverage. 74% of retail investor accounts lose money when trading CFDs with this provider. You should consider whether you understand how CFDs work and whether you can afford to take the high risk of losing your money.

BNB Price Forecast: BNB loses strength as crypto market drops

Source Fxstreet
  • BNB edges lower by nearly 1% on Wednesday, extending the decline below the 200-day EMA.
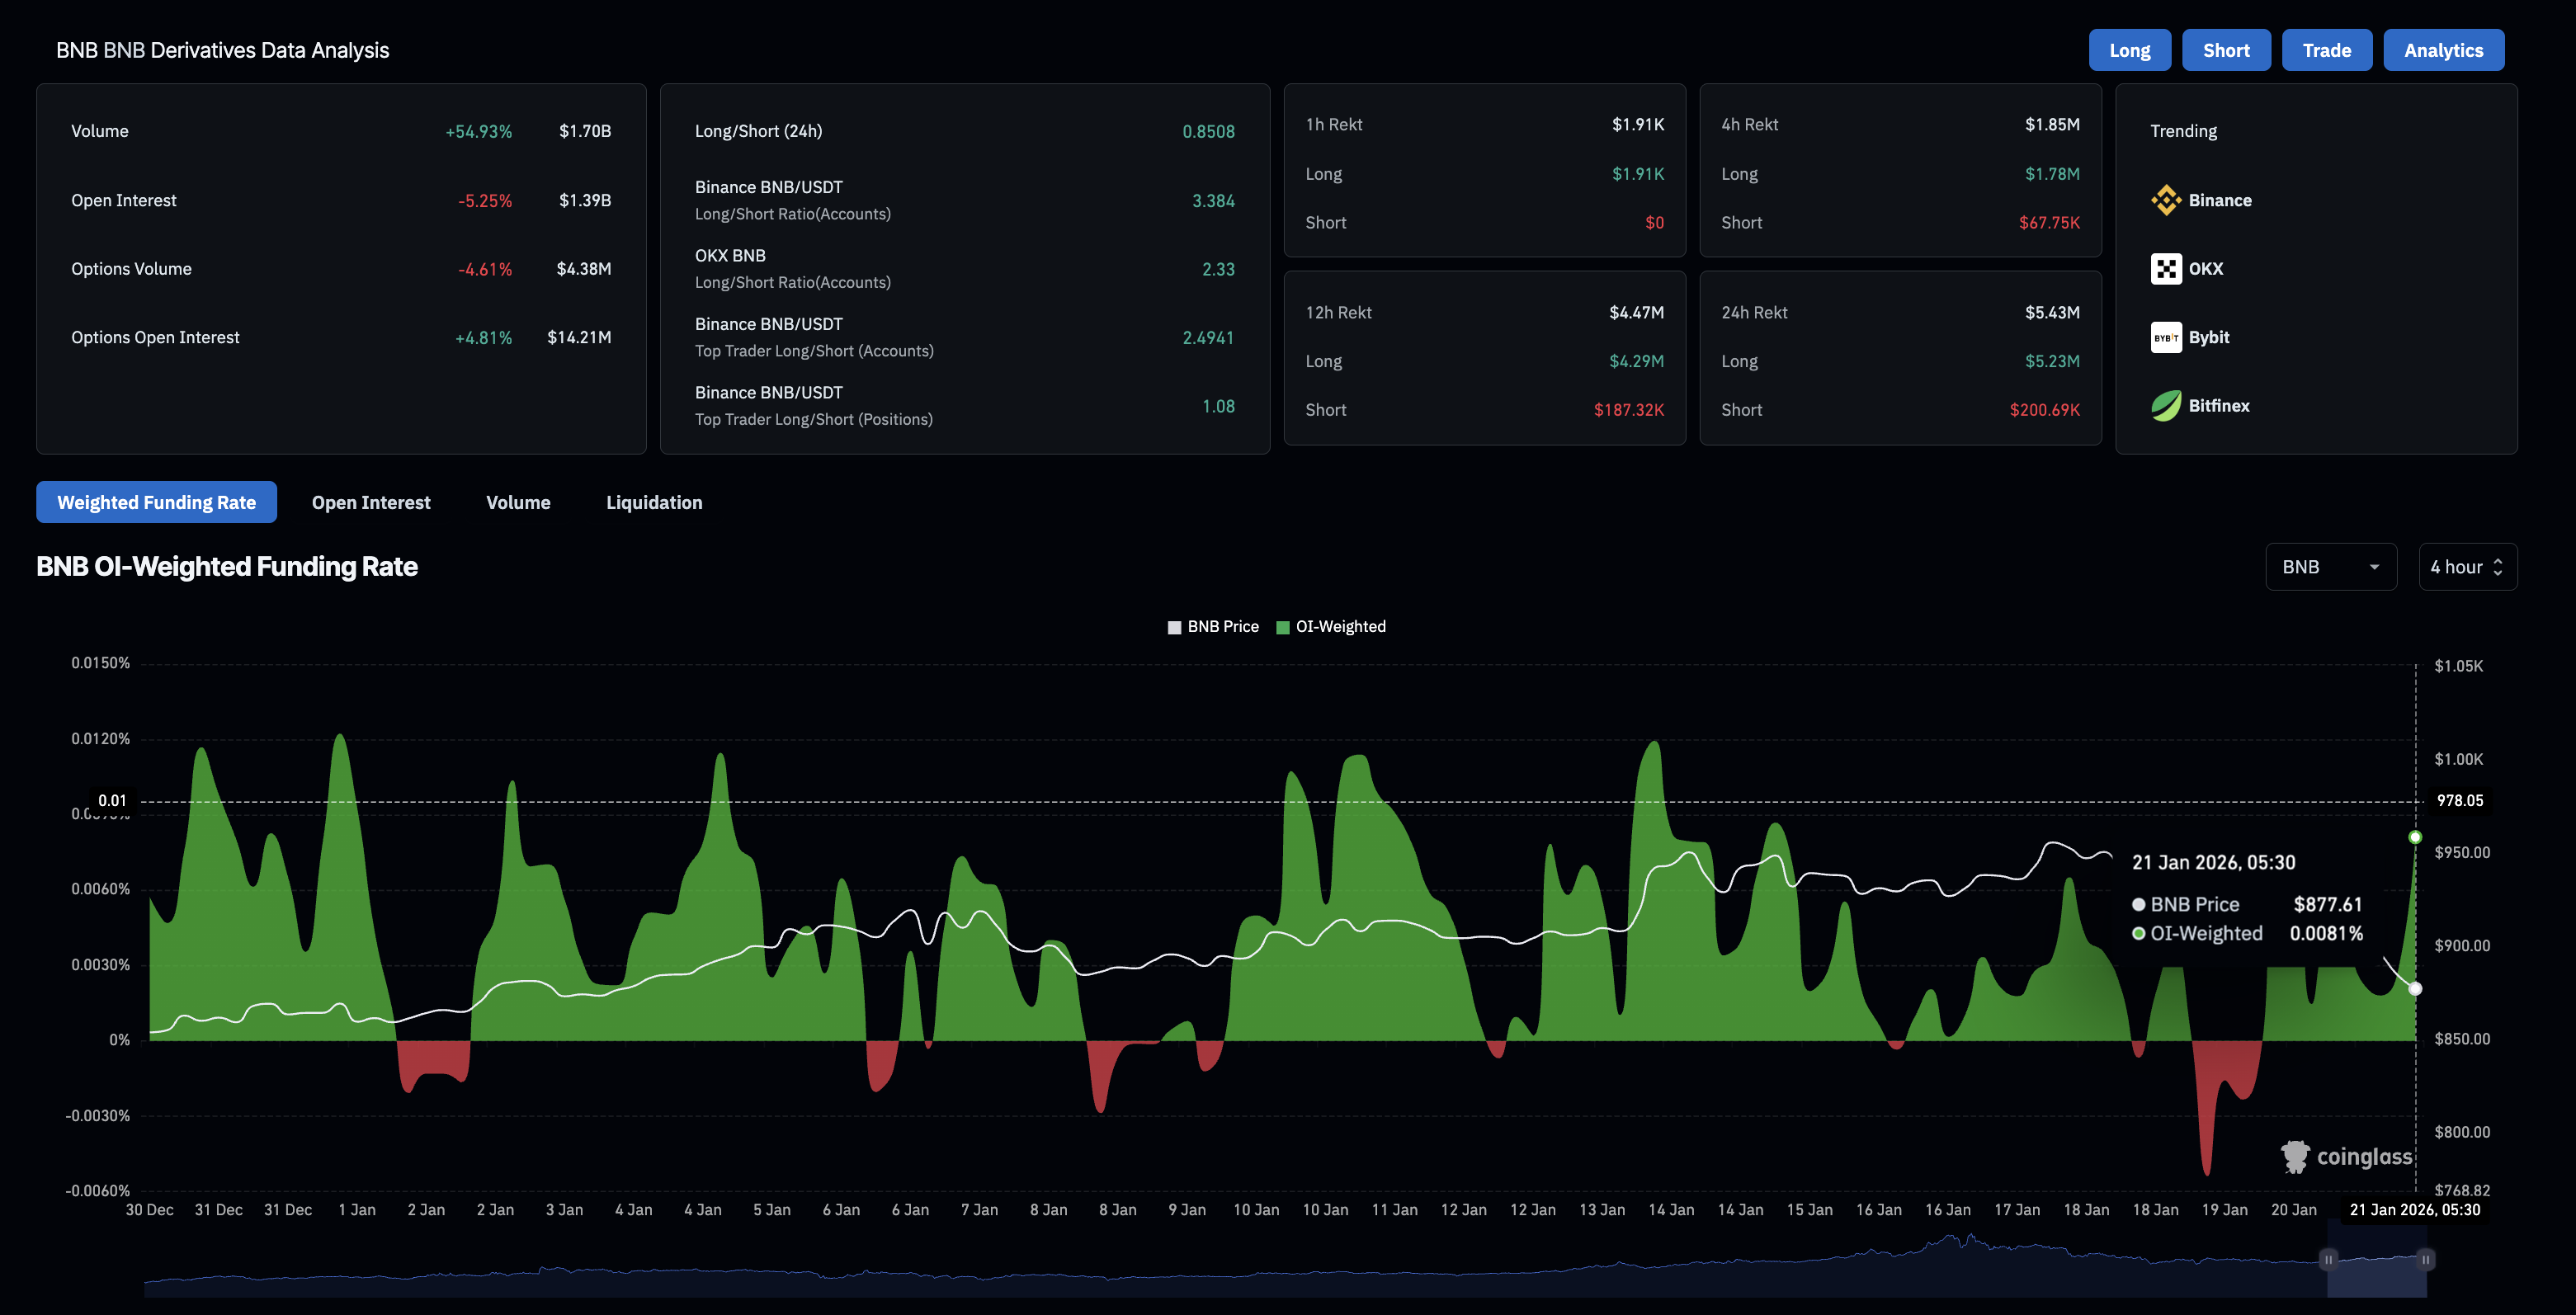
  • Derivatives data signals increased long liquidations and over 5% reduction in Open Interest, indicating a bearish shift in sentiment.
  • The path of least resistance for BNB signals further downside risk toward $800.

BNB (formerly Binance Coin) loses ground as the broader cryptocurrency market falls, recording a 1% drop at the time of writing on Wednesday. Retail interest in the exchange token is declining, as evidenced by the massive wipeout of long positions and a decline in futures Open Interest. The technical outlook for BNB suggests further downside risk, as momentum indicators flash a sell signal.

Retail sentiment dims amid large liquidations

CoinGlass data shows that BNB Open Interest dropped by 5.25% to $1.39 billion over the last 24 hours, suggesting a decline in the value of outstanding futures contracts as traders close positions or reduce leverage. 

A surge in long liquidations to $5.23 million over the last 24 hours, outpacing short liquidations of $220,690 by a wide margin, suggests that the wipeout of mostly bullish positions reduced capital exposure in BNB futures.

BNB derivatives data. Source: CoinGlass

Technical outlook: Will BNB price crash to $800?

BNB price holds marginally below the 200-day Exponential Moving Average (EMA) at $883, while the 50-day EMA at $902 is sloping downward, suggesting a potential Death Cross. 

The Moving Average Convergence Divergence (MACD) slips below the red line, races toward zero, widens the negative histogram, and suggests a surge in bearish momentum. 

The Relative Strength Index (RSI) is at 42, crossing below the halfway line, indicating a surge in bearish momentum.

To reinstate an upward trend, BNB should resurface above the 200-day EMA at $883, which would improve the upside bias and target the 50-day EMA at $902. 

BNB/USDT daily price chart.

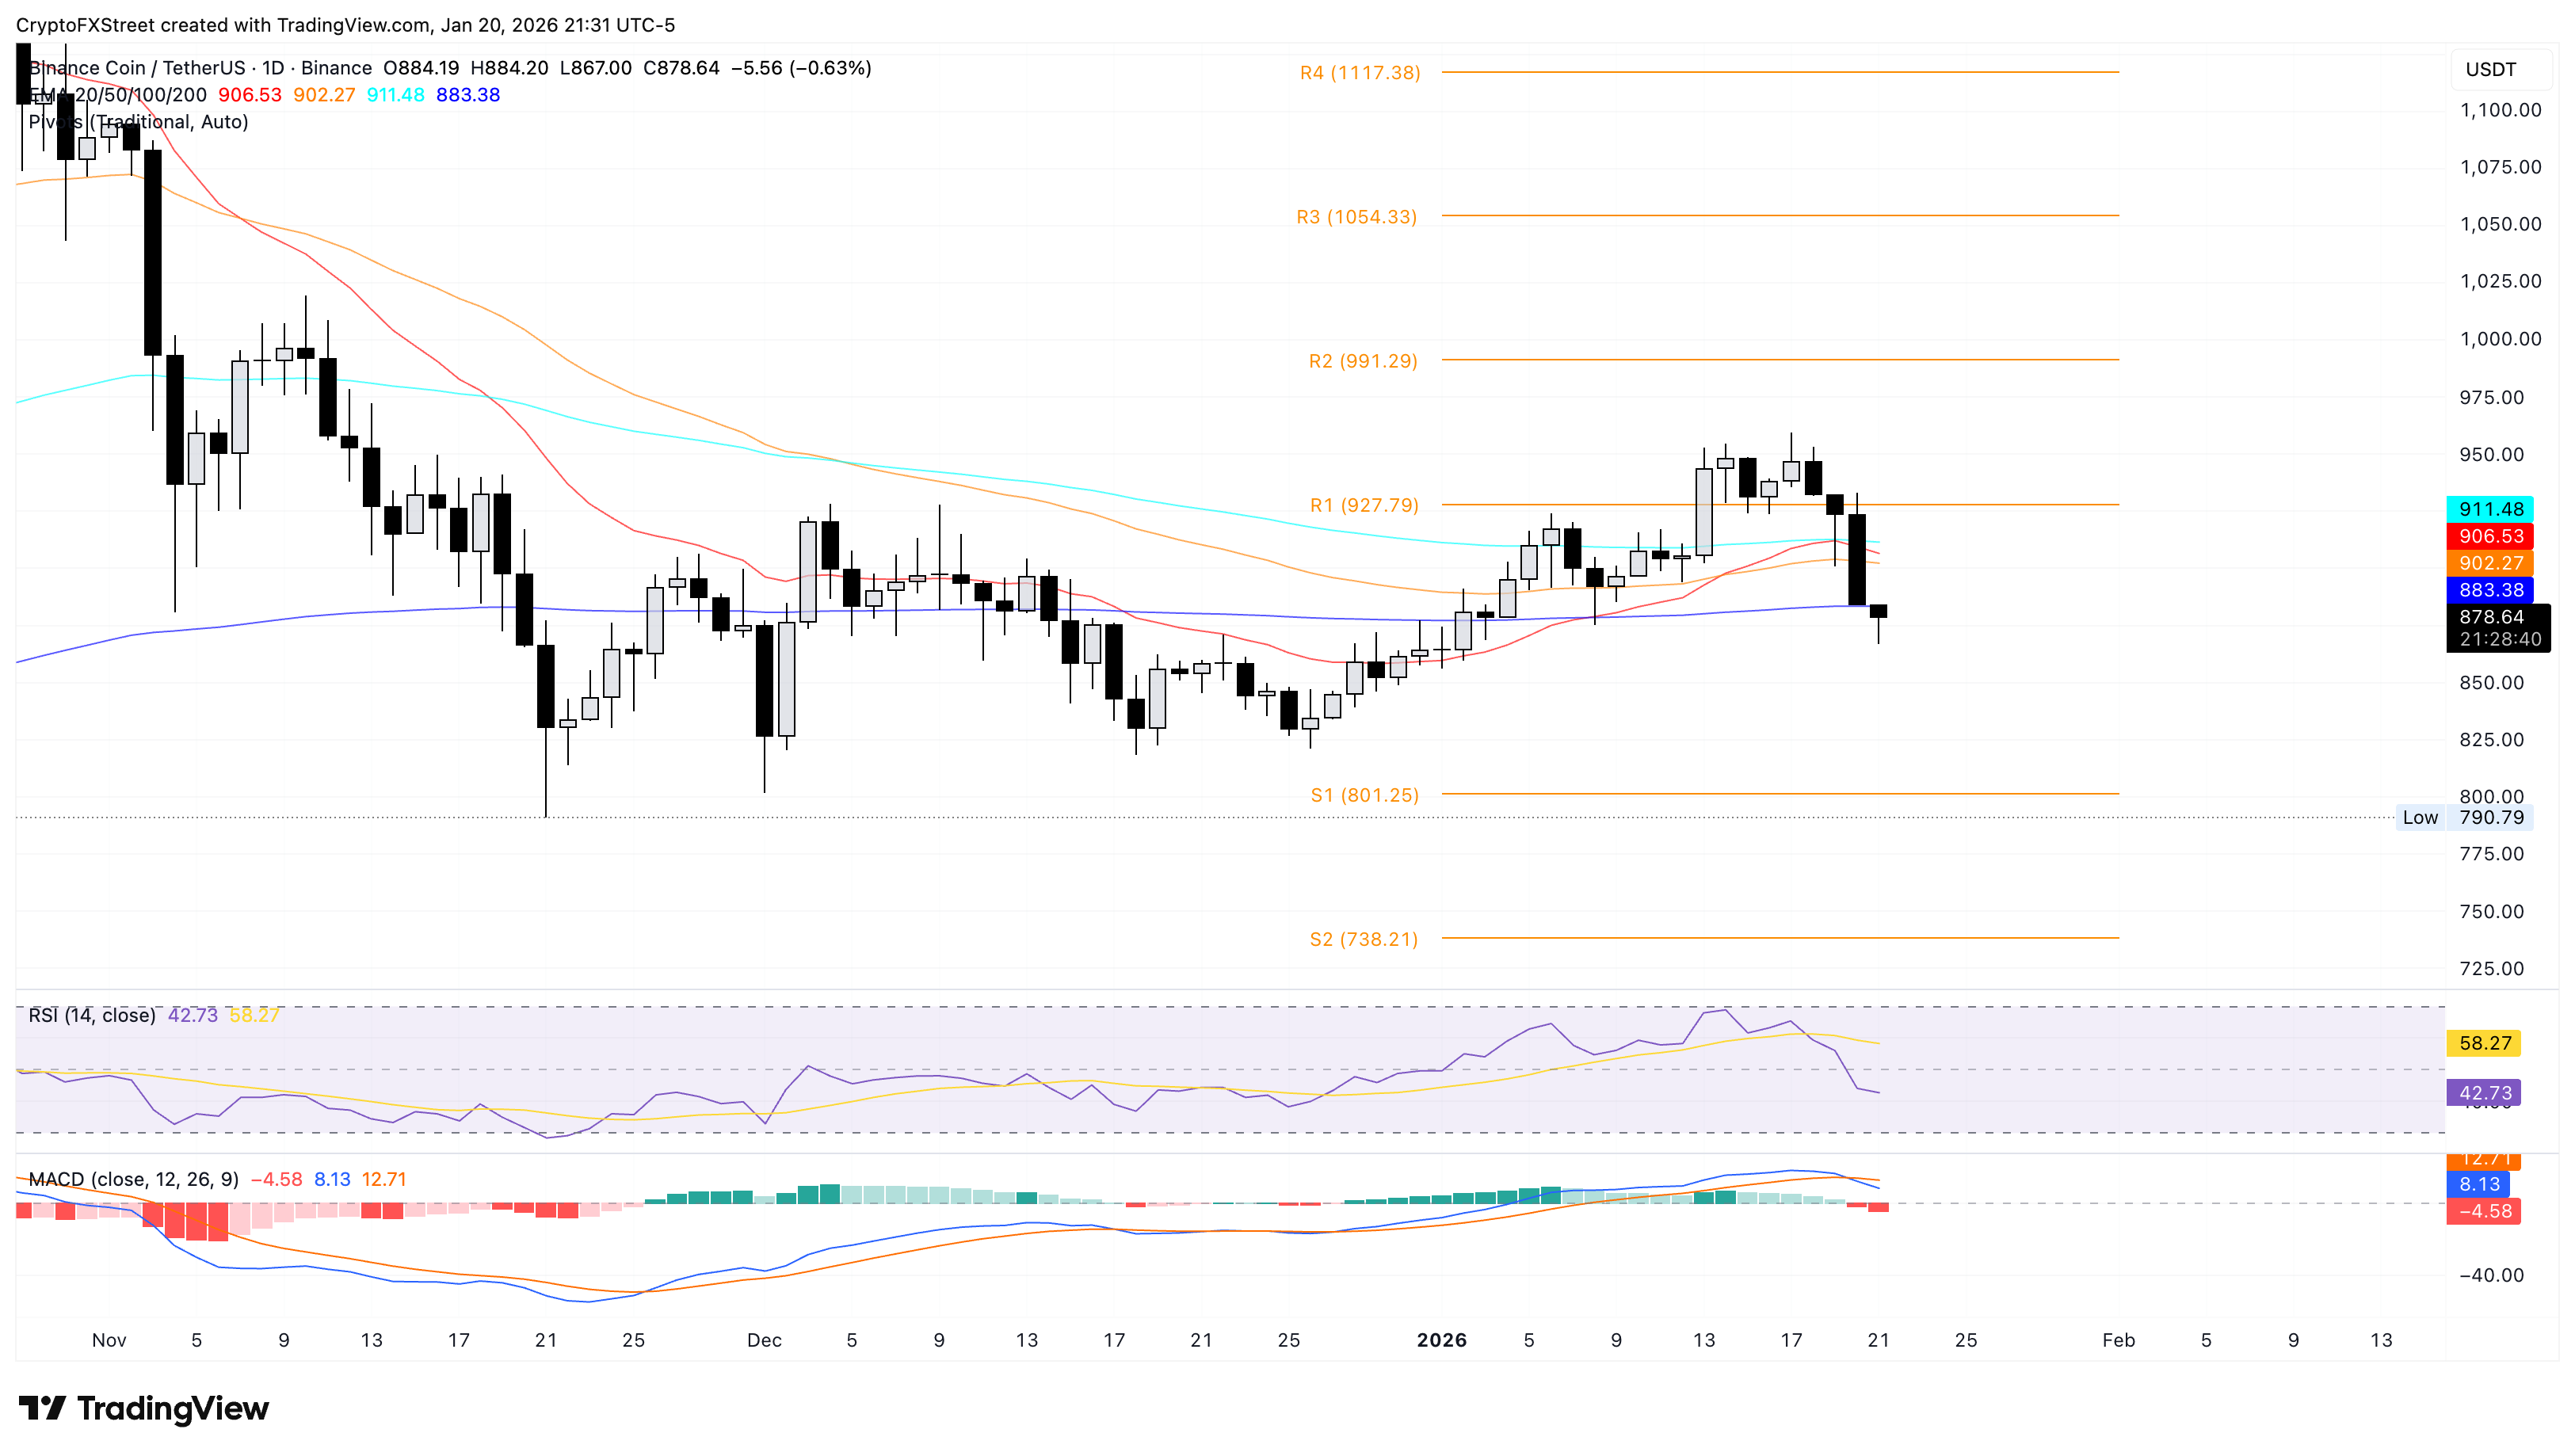
However, the path of least resistance targets the S1 Pivot Point at $801, consistent with the bearish shift in momentum.

(The technical analysis of this story was written with the help of an AI tool.)

Disclaimer: The content available on Mitrade Insights is provided for informational and marketing purposes only. It has not been prepared in accordance with legal requirements designed to promote the independence of investment research and is not subject to any prohibition on dealing ahead of the dissemination of investment research
Nothing in this material constitutes investment advice, personal recommendation, investment research, an offer, or a solicitation to buy or sell any financial instrument. The content has been prepared without consideration of your individual investment objectives, financial situation, or needs, and should not be treated as such.
Past performance is not a reliable indicator of future performance and/or results. Forward-looking scenarios or forecasts are not a guarantee of future performance. Actual results may differ materially from those anticipated.
Mitrade makes no representation or warranty as to the accuracy or completeness of the information provided and accepts no liability for any loss arising from reliance on such information.
placeholder
Bitcoin Open Interest Plunges: Derivatives 'Flush Out' May Signal Major BottomBitcoin open interest has seen its sharpest 30-day drop of the cycle, with 1.3 million BTC in futures wiped out as price falls over 30% from $126,000 — a deleveraging that analyst “Darkfost” says could mark a bottom if BTC can later reclaim the $90,000–$96,000 zone and revive the bull trend.
Author  Mitrade
Nov 24, 2025
Bitcoin open interest has seen its sharpest 30-day drop of the cycle, with 1.3 million BTC in futures wiped out as price falls over 30% from $126,000 — a deleveraging that analyst “Darkfost” says could mark a bottom if BTC can later reclaim the $90,000–$96,000 zone and revive the bull trend.
placeholder
Pi Network Price Forecast: Whale Accumulation and Technical Confluence Put PI on Breakout WatchPi Network trades higher near a key $0.247 resistance zone, with whale accumulation, a 50-day EMA/Fibonacci confluence and bullish RSI–MACD signals all putting PI on breakout watch as long as weekly support at $0.221 holds.
Author  Mitrade
Nov 24, 2025
Pi Network trades higher near a key $0.247 resistance zone, with whale accumulation, a 50-day EMA/Fibonacci confluence and bullish RSI–MACD signals all putting PI on breakout watch as long as weekly support at $0.221 holds.
placeholder
Pi Network Price Forecast: PI falls as December token unlock overshadows gaming partnershipPi Network (PI) is down 4% by press time on Friday, after three days of an uptrend fueled by the CiDi Games partnership announcement on Wednesday.
Author  FXStreet
Nov 28, 2025
Pi Network (PI) is down 4% by press time on Friday, after three days of an uptrend fueled by the CiDi Games partnership announcement on Wednesday.
placeholder
GBP/USD Price Forecast: Softens below 1.3500 but retains positive technical outlookThe GBP/USD pair loses momentum near 1.3485 during the early European session on Monday, pressured by renewed US Dollar (USD) demand. The potential downside for a major pair might be limited, as the Bank of England (BoE) guided that monetary policy will remain on a gradual downward path.
Author  FXStreet
Dec 29, 2025
The GBP/USD pair loses momentum near 1.3485 during the early European session on Monday, pressured by renewed US Dollar (USD) demand. The potential downside for a major pair might be limited, as the Bank of England (BoE) guided that monetary policy will remain on a gradual downward path.
placeholder
WTI drops below $64.00, Middle East tensions in focusWest Texas Intermediate (WTI), the US crude oil benchmark, is trading around $63.80 during the early Asian trading hours on Tuesday. The WTI price falls as concerns about supply disruptions in the Middle East have faded.
Author  FXStreet
Feb 10, Tue
West Texas Intermediate (WTI), the US crude oil benchmark, is trading around $63.80 during the early Asian trading hours on Tuesday. The WTI price falls as concerns about supply disruptions in the Middle East have faded.
Related Instrument
goTop
quote