CFDs are complex instruments and come with a high risk of losing money rapidly due to leverage. 78% of retail investor accounts lose money when trading CFDs with this provider. You should consider whether you understand how CFDs work and whether you can afford to take the high risk of losing your money.

Meme Coins Price Prediction: DOGE surges, Shiba Inu, Pepe await breakout signals

Source Fxstreet
  • Dogecoin is trading above $0.106 on Thursday, up 6.5% so far this week.
  • Shiba Inu is near the upper boundary of its consolidation at $0.0000063, a breakout suggests a rally ahead.
  • Pepe price hovers between the 50-day and 100-day EMAs, signaling indecision among traders.

Dogecoin (DOGE) extends its upward momentum on Thursday, trading above $0.106 and leading gains among major meme coins. Meanwhile, Shiba Inu (SHIB) and Pepe (PEPE) remain range-bound, signaling a pause in momentum as both meme coins consolidate near key resistance levels. A firm close above these key resistance zones could trigger the next leg of upside for these meme coins.

Dogecoin takes the lead

Dogecoin's price is extending its gains, trading above $0.106 on Wednesday and surpassing the key 100-day Exponential Moving Average (EMA) at $0.104.

If DOGE continues its upward momentum and closes above 38.20% Fibonacci retracement level at $0.109 on a daily basis, it could extend the gains toward the weekly resistance at $0.119.

The Relative Strength Index (RSI) on the daily chart is 71, above the overbought threshold and pointing upward, indicating strong bullish momentum. Moreover, the Moving Average Convergence Divergence (MACD) indicator on the same chart shows rising green histogram bars, supporting the positive outlook.

DOGE/USDT daily chart

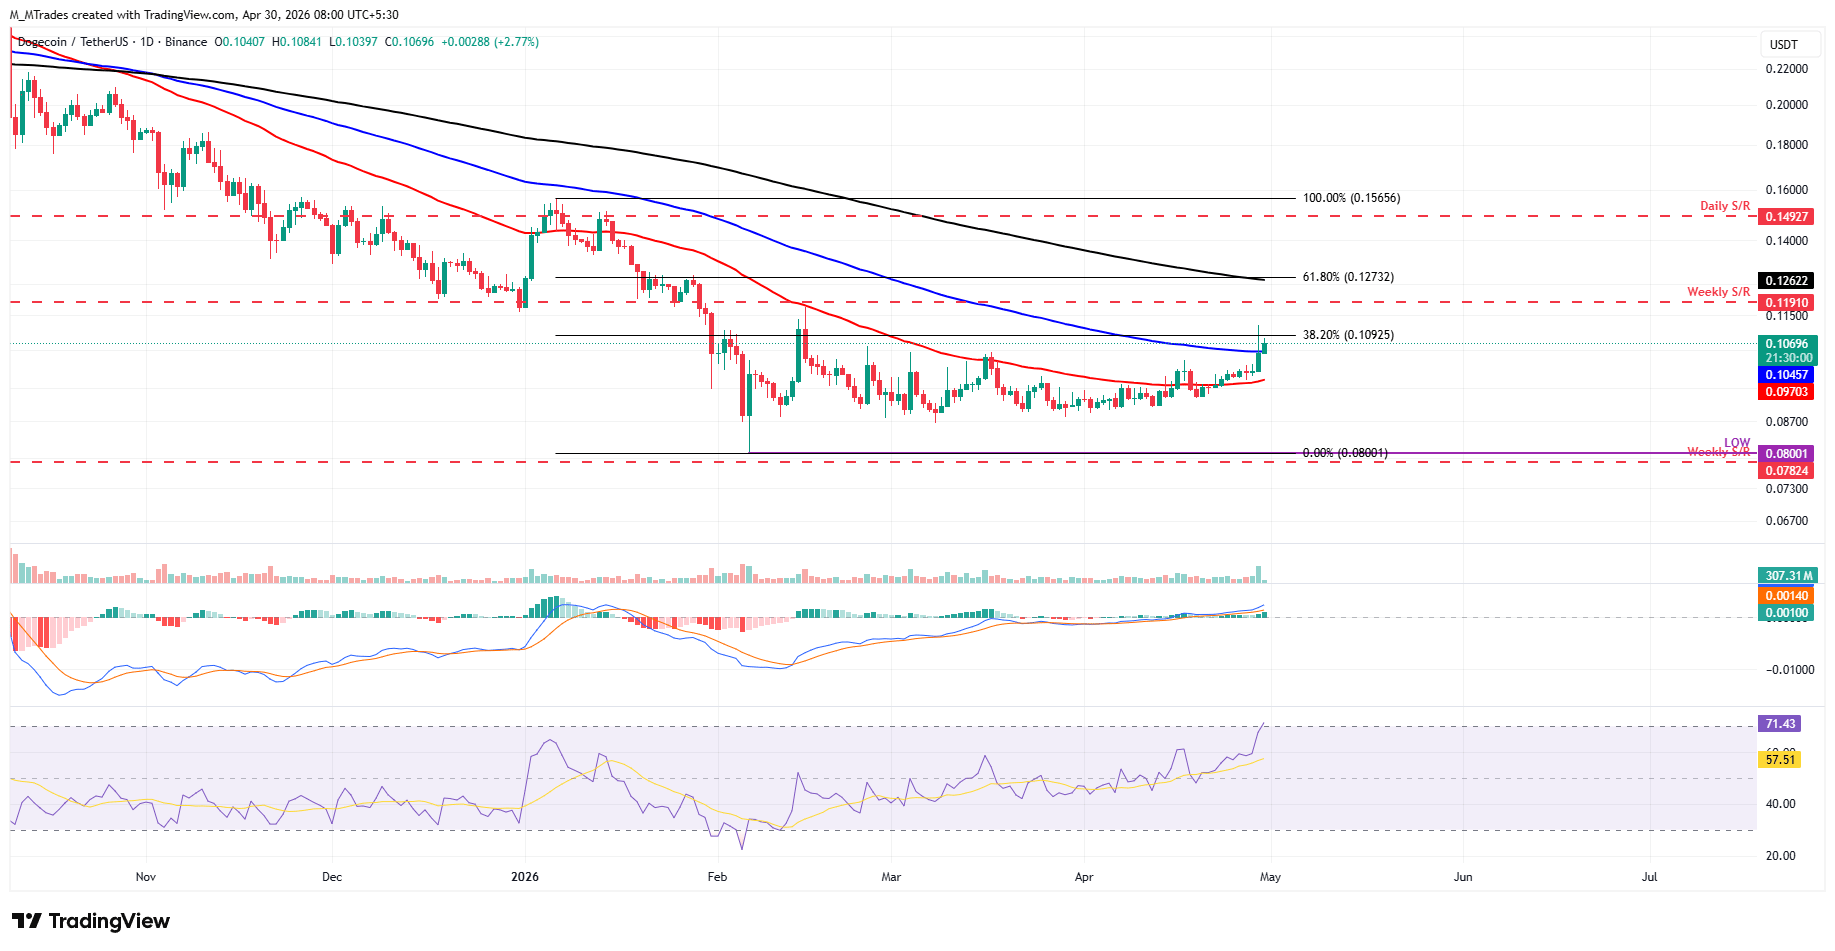
However, if DOGE faces a correction, it could extend the decline toward the 50-day EMA at $0.097.

Shiba Inu could extend gains if it closes above the upper consolidation boundary

Shiba Inu price surged sharply on Wednesday but was rejected from the 100-day EMA at $0.0000064, closing the day with mild gains. As of writing on Thursday, SHIB is approaching the upper consolidation boundary at $0.0000064, where a break above suggests a bullish move.

If SHIB closes above this upper boundary on a daily basis, it could extend the rally toward the 100-day EMA at $0.0000064. A firm close above this level could extend gains toward the weekly resistance at $0.0000068.

The RSI on the daily chart reads 56, above the neutral level of 50 and below the overbought threshold, indicating bullish momentum. Moreover, the MACD indicator on the same chart shows green histogram bars, supporting the positive outlook.

SHIB/USDT daily chart

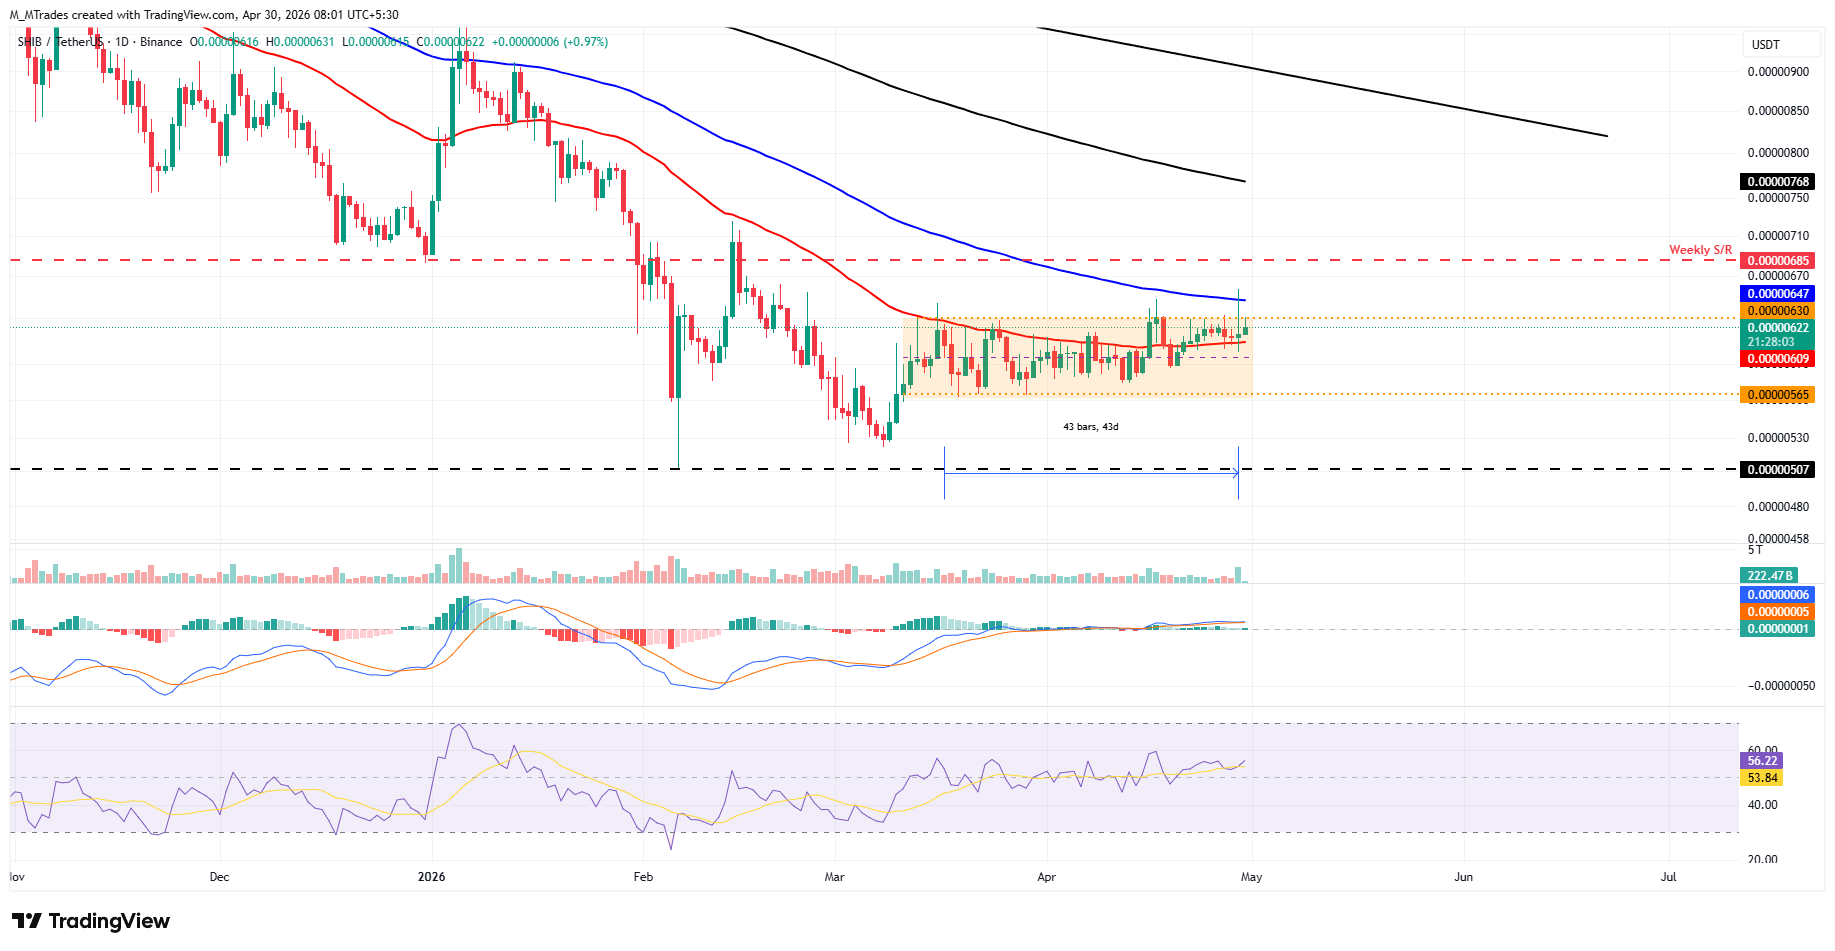
If SHIB faces rejection and corrects, it could extend the decline toward the lower channel range at $0.0000056.

Pepe trades sideways between 50-day and 100-day EMAs

Pepe price has been trading between the 50-day and 100-day EMAs at $0.0000037 and $0.0000040 since last week. As of writing on Thursday, PEPE is hovering at $0.0000038.

If PEPE closes above the 100-day EMA at $0.0000040 on a daily basis, it could extend the rally toward the 200-day EMA at $0.0000050, which roughly coincides with the daily resistance.

The RSI on the daily chart is 54, above the neutral 50 level, indicating mild bullish strength. Moreover, the MACD indicator is converging, indicating indecision among the traders.

PEPE/USDT daily chart

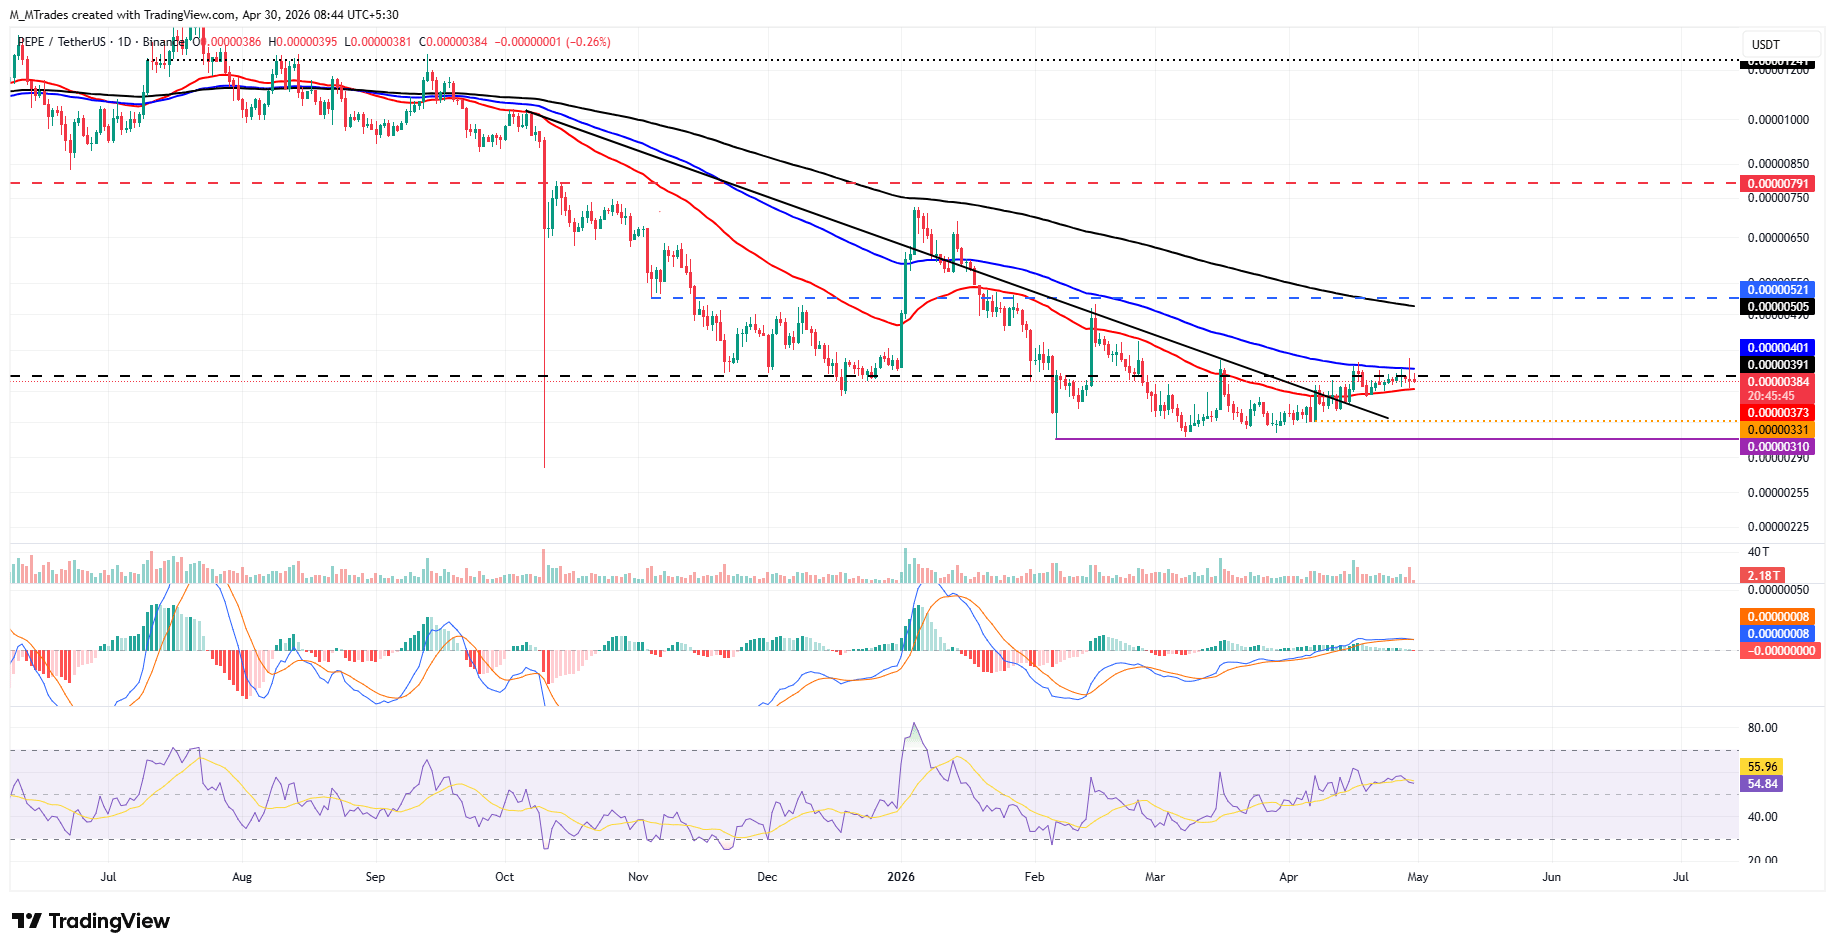
On the other hand, if PEPE pulls back and closes below the 50-day EMA at $0.0000037, it could extend the decline toward the April 7 low at $0.0000033.

Disclaimer: The content available on Mitrade Insights is provided for informational and marketing purposes only. It has not been prepared in accordance with legal requirements designed to promote the independence of investment research and is not subject to any prohibition on dealing ahead of the dissemination of investment research
Nothing in this material constitutes investment advice, personal recommendation, investment research, an offer, or a solicitation to buy or sell any financial instrument. The content has been prepared without consideration of your individual investment objectives, financial situation, or needs, and should not be treated as such.
Past performance is not a reliable indicator of future performance and/or results. Forward-looking scenarios or forecasts are not a guarantee of future performance. Actual results may differ materially from those anticipated.
Mitrade makes no representation or warranty as to the accuracy or completeness of the information provided and accepts no liability for any loss arising from reliance on such information.
placeholder
Top 3 Price Prediction: Bitcoin rallies above $92,000 as Ethereum, Ripple show resilienceBitcoin (BTC), Ethereum (ETH), and Ripple (XRP) are trading in green on Monday, fueling a broader cryptocurrency market recovery. Bitcoin and Ethereum extend gains for the second consecutive day, crossing above $92,000 and $3,100, respectively, while XRP stabilizes near $2.00.
Author  FXStreet
Jan 12, Mon
Bitcoin (BTC), Ethereum (ETH), and Ripple (XRP) are trading in green on Monday, fueling a broader cryptocurrency market recovery. Bitcoin and Ethereum extend gains for the second consecutive day, crossing above $92,000 and $3,100, respectively, while XRP stabilizes near $2.00.
placeholder
Gold stocks lead sell-off in Australian shares ahead of central bank meetingAXJO closes down 1% in worst day in two monthsGold miners down 7.2%, worst day since late OctoberRBA expected to hike interest rate - Reuters pollBy Shruti Agarwal Feb 2 (Reuters) - Australian shares clocked their steepest losses in two months on Monday, weighed down by precious and base metal m...
Author  Reuters
Feb 02, Mon
AXJO closes down 1% in worst day in two monthsGold miners down 7.2%, worst day since late OctoberRBA expected to hike interest rate - Reuters pollBy Shruti Agarwal Feb 2 (Reuters) - Australian shares clocked their steepest losses in two months on Monday, weighed down by precious and base metal m...
placeholder
Financial Markets 2026: Volatility Catalysts in Gold, Silver, Oil, and Blue-Chip Stocks—A CFD Trader's OutlookThe financial world is perpetually in motion, but the landscape for 2026 seems to be shaping up to be particularly dynamic. For CFD traders navigating global markets, this heightened volatility could present a distinctive set of challenges and opportunities.
Author  Rachel Weiss
Mar 05, Thu
The financial world is perpetually in motion, but the landscape for 2026 seems to be shaping up to be particularly dynamic. For CFD traders navigating global markets, this heightened volatility could present a distinctive set of challenges and opportunities.
placeholder
J.P.Morgan downgrades India equities to 'neutral' on oil-led earnings risks, higher valuationsBy Bharath Rajeswaran April 24 (Reuters) - J.P.Morgan downgraded Indian equities to "neutral" from "overweight," citing elevated valuations compared to emerging market peers and pressure on earnings from energy supply shocks linked to the Iran war, a day after HSBC lowered its rat...
Author  Reuters
Apr 24, Fri
By Bharath Rajeswaran April 24 (Reuters) - J.P.Morgan downgraded Indian equities to "neutral" from "overweight," citing elevated valuations compared to emerging market peers and pressure on earnings from energy supply shocks linked to the Iran war, a day after HSBC lowered its rat...
placeholder
USD: Liquidity backstops and war pressures – CommerzbankCommerzbank’s Michael Pfister discusses how US allies in Middle East and Asia are seeking Dollar swap lines as conflicts curb energy exports and tourism.
Author  Reuters
Apr 24, Fri
Commerzbank’s Michael Pfister discusses how US allies in Middle East and Asia are seeking Dollar swap lines as conflicts curb energy exports and tourism.
Related Instrument
goTop
quote