



Cardano Price Forecast: ADA targets $0.30 breakout as technicals improve
- Cardano advances for a third consecutive day and holds above $0.26 as bulls tighten their grip.
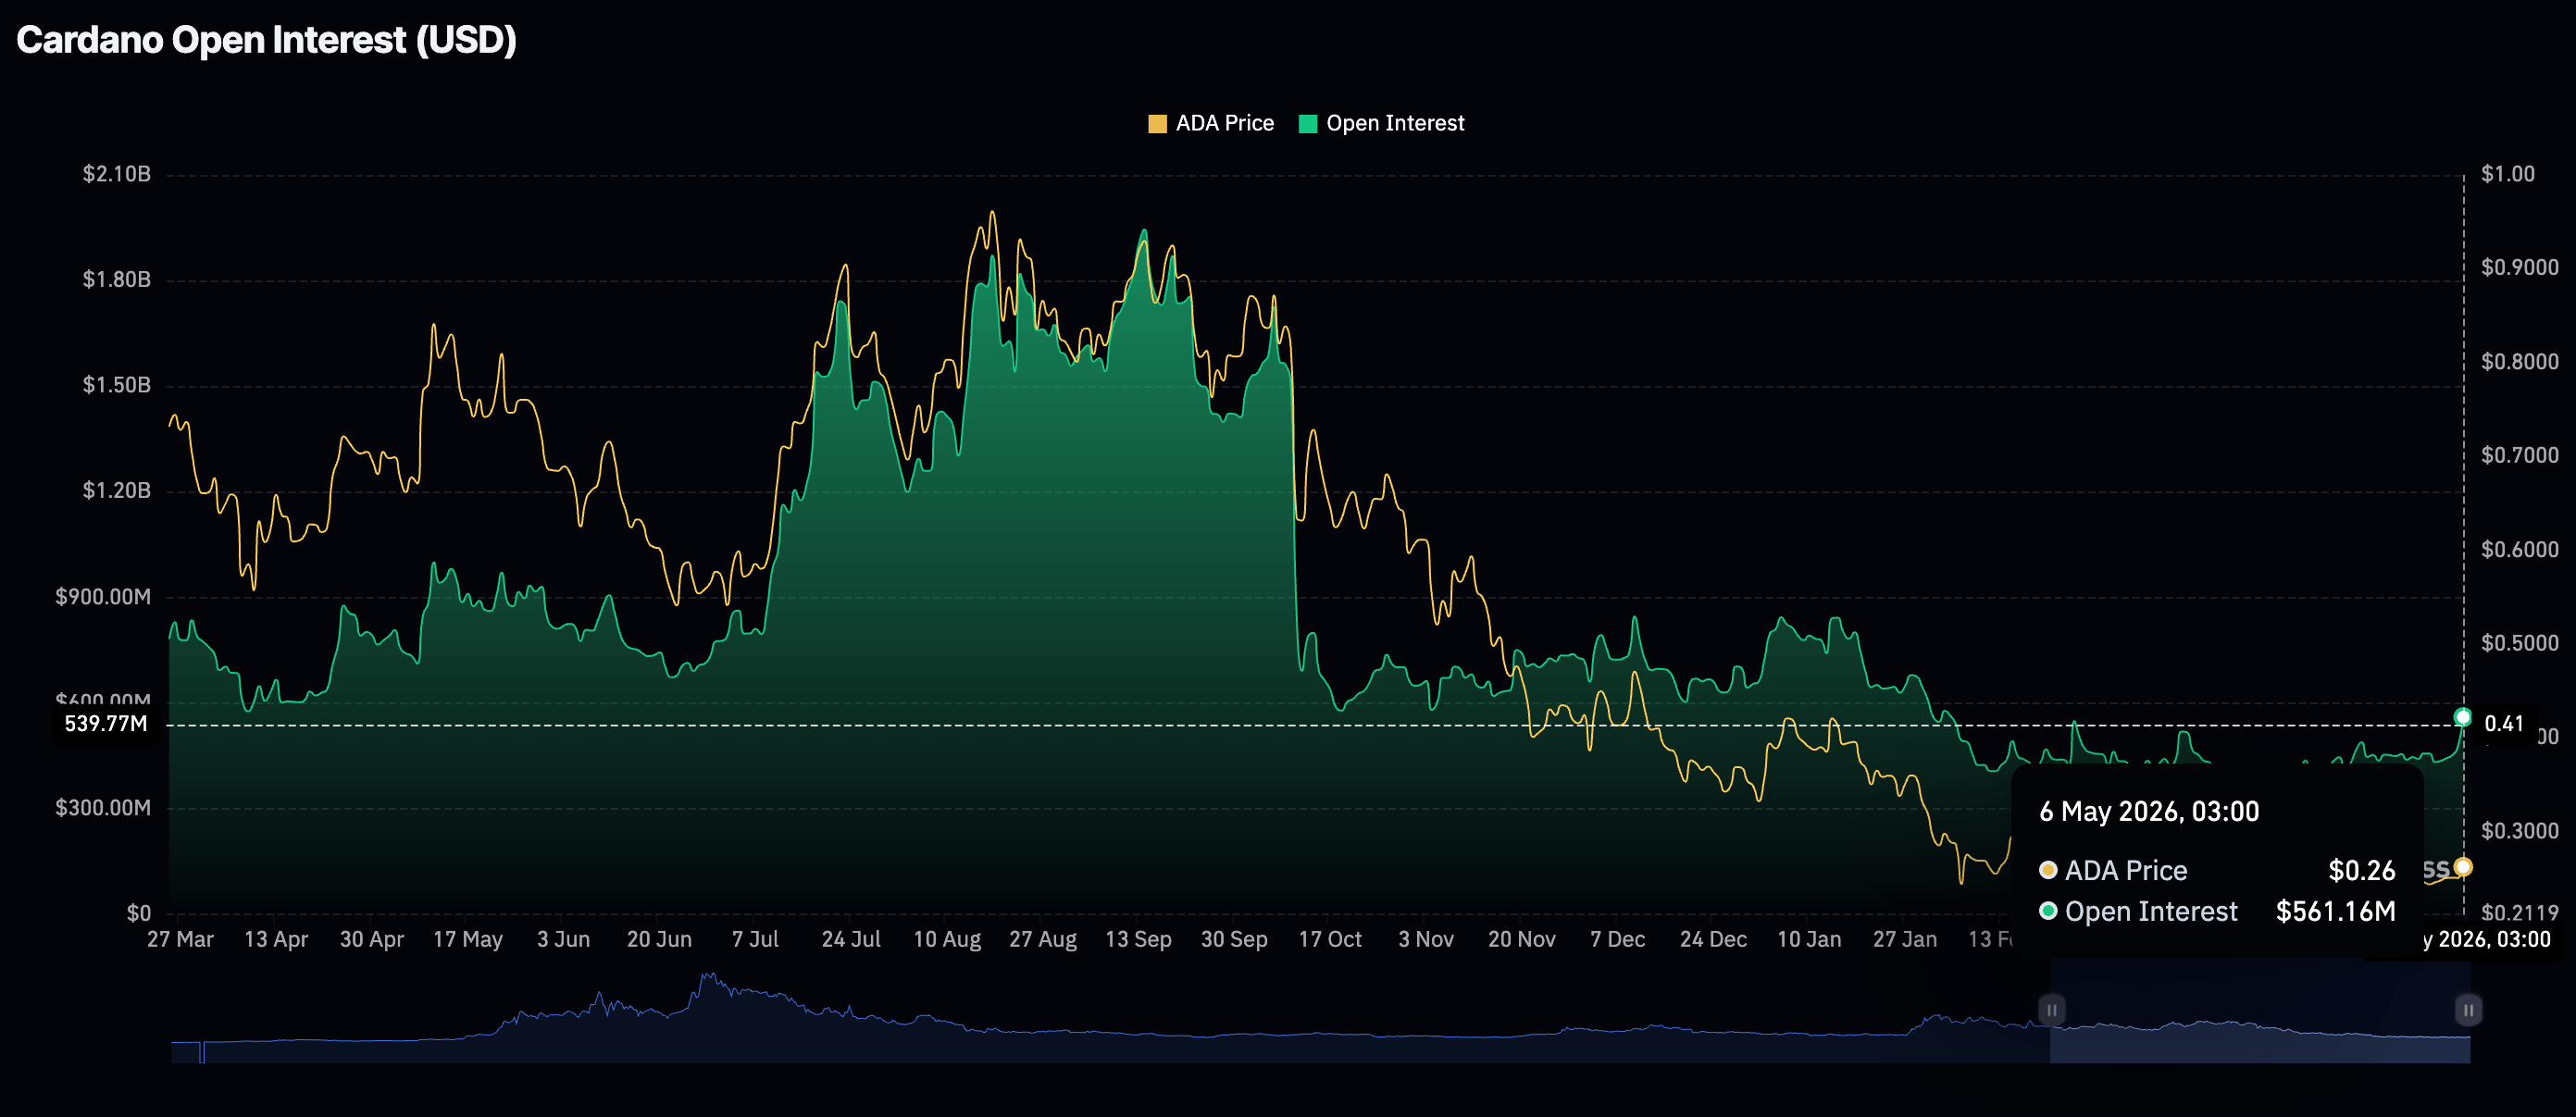
- ADA retail demand returns, with the perpetual futures Open Interest climbing to $651 million on Wednesday.
- Cardano’s rebound builds on the 50-day EMA support while the MACD upholds a buy signal.
Cardano (ADA) is extending its early-week rebound above $0.260 at the time of writing on Wednesday, building on improving sentiment in the broader crypto market after the United States (US) signaled a final peace agreement with Iran.
The US also paused “Project Freedom,” easing pressure on Oil prices, which trade at $93.62, down from the West Texas Intermediate (WTI) weekly high of $103.86.
Risk appetite across crypto markets remains largely stable, with the Fear & Greed Index registering 46 on Wednesday, a marginal decline from 50 the previous day, reflecting a consistently cautious yet optimistic investor stance.
Retail demand boosts Cardano’s recovery outlook
Retail investors are making a comeback, increasing their risk exposure through derivatives. CoinGlass data shows the perpetual futures Open Interest (OI) averaging $651 million on Wednesday, up from roughly $474 million the previous day and $452 million on Monday.
A sustained rise in open interest is crucial to validating Cardano’s bullish momentum, indicating that market participants have strong conviction in ADA’s ability to maintain its recent gains.
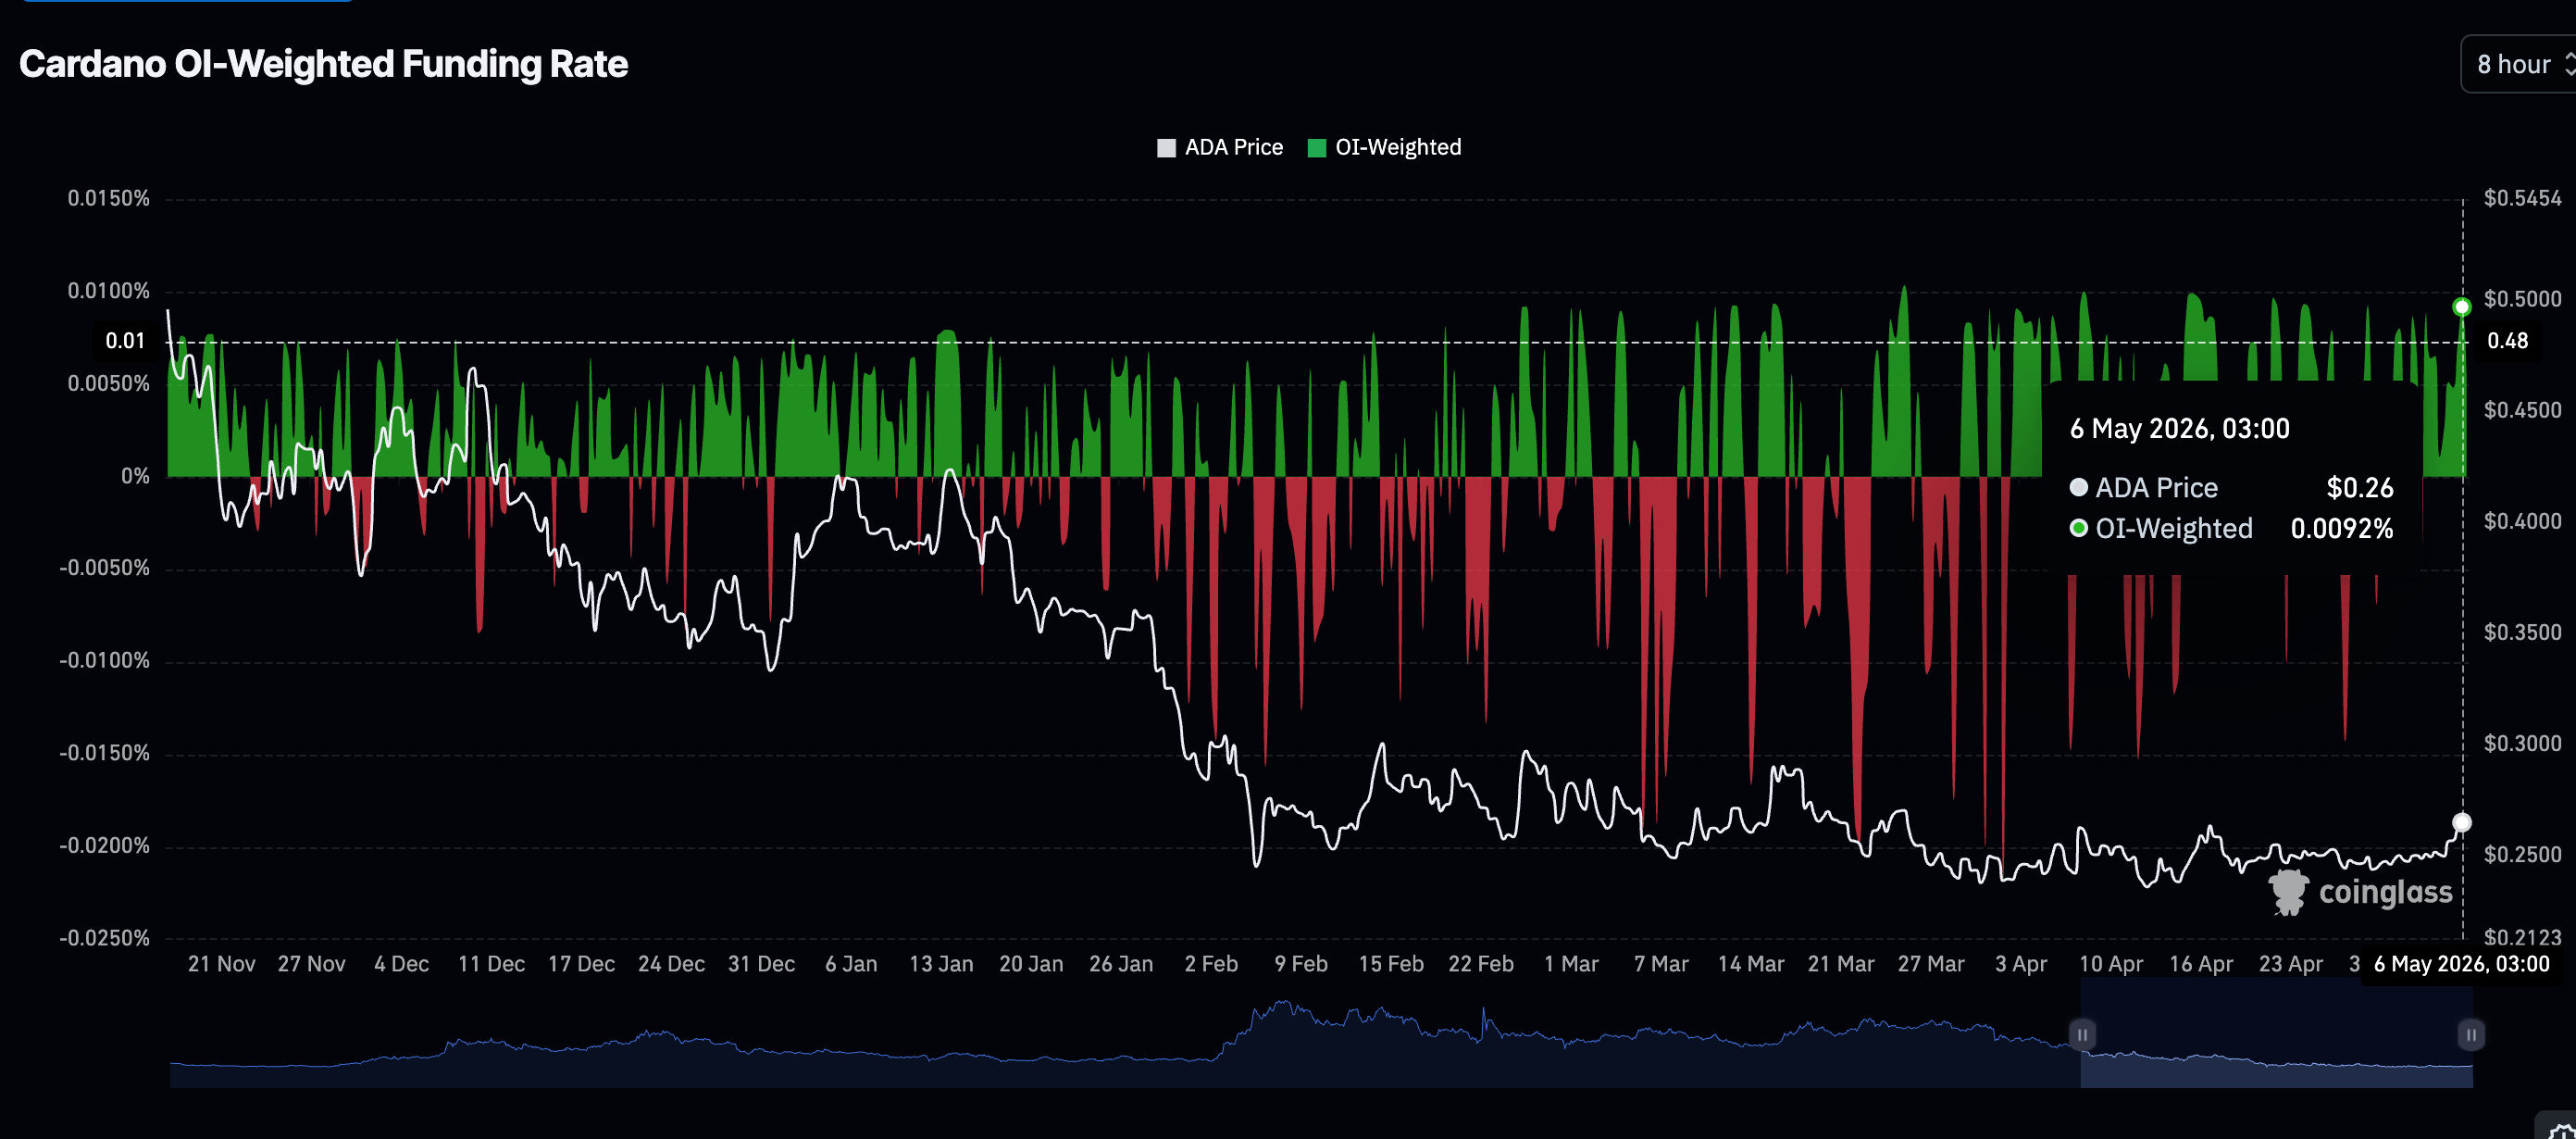
The OI-Weighted Funding Rate, currently 0.0092%, indicates that traders are increasingly piling into long positions in Cardano. This metric has remained in positive territory since Sunday, further aligning with the short- to medium-term bullish outlook.
Technical outlook: ADA holds steady above $0.26
Cardano trades at $0.267, extending its rebound above the former downward resistance line around $0.253 and the 50-day Exponential Moving Average (EMA) at $0.256. Still, the broader tone remains capped as price still trades beneath the SuperTrend indicator at $0.275 and the 100-day EMA near $0.285.
Momentum has improved, with the Relative Strength Index (RSI) advancing above 64 on the daily chart and the Moving Average Convergence Divergence (MACD) histogram turning positive, suggesting buyers are tightening their grip.
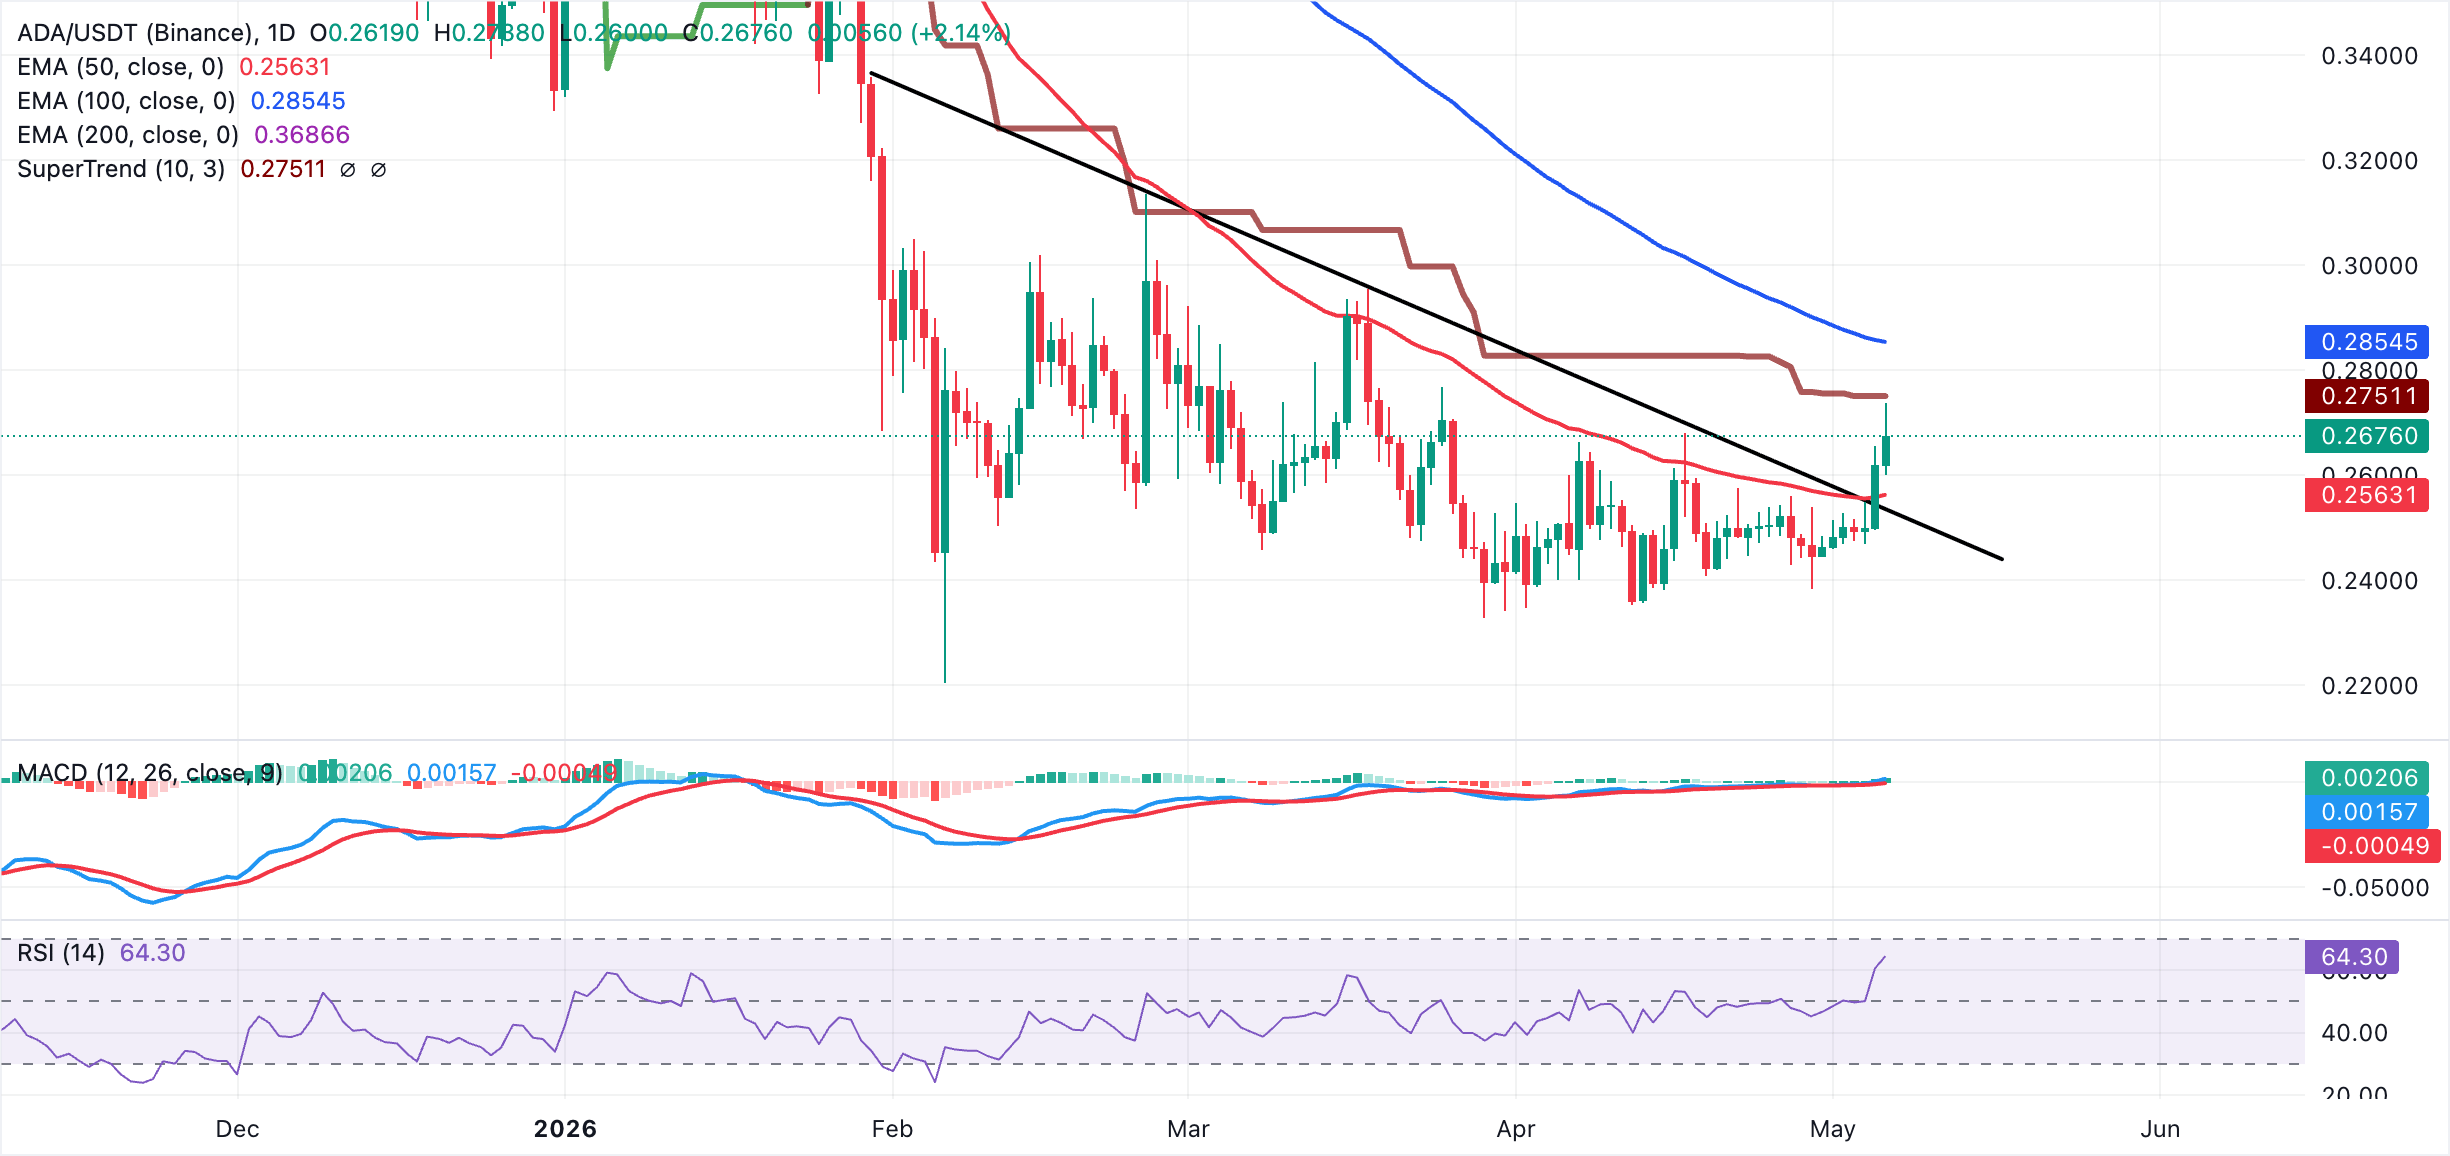
On the topside, initial resistance is seen at the SuperTrend line around $0.275, followed by the clustered 100-day EMA near $0.285, while the 200-day EMA, much higher at $0.369, remains a broader bearish barrier.
On the downside, immediate support lies at the recent pivot area around $0.267, ahead of the reclaimed trendline break zone near $0.253 and the 50-day EMA at $0.256, with a sustained move back below these levels likely to expose ADA to renewed downside pressure.
(The technical analysis of this story was written with the help of an AI tool.)
Cryptocurrency prices FAQs
Token launches influence demand and adoption among market participants. Listings on crypto exchanges deepen the liquidity for an asset and add new participants to an asset’s network. This is typically bullish for a digital asset.
A hack is an event in which an attacker captures a large volume of the asset from a DeFi bridge or hot wallet of an exchange or any other crypto platform via exploits, bugs or other methods. The exploiter then transfers these tokens out of the exchange platforms to ultimately sell or swap the assets for other cryptocurrencies or stablecoins. Such events often involve an en masse panic triggering a sell-off in the affected assets.
Macroeconomic events like the US Federal Reserve’s decision on interest rates influence crypto assets mainly through the direct impact they have on the US Dollar. An increase in interest rate typically negatively influences Bitcoin and altcoin prices, and vice versa. If the US Dollar index declines, risk assets and associated leverage for trading gets cheaper, in turn driving crypto prices higher.
Halvings are typically considered bullish events as they slash the block reward in half for miners, constricting the supply of the asset. At consistent demand if the supply reduces, the asset’s price climbs.
Nothing in this material constitutes investment advice, personal recommendation, investment research, an offer, or a solicitation to buy or sell any financial instrument. The content has been prepared without consideration of your individual investment objectives, financial situation, or needs, and should not be treated as such.
Past performance is not a reliable indicator of future performance and/or results. Forward-looking scenarios or forecasts are not a guarantee of future performance. Actual results may differ materially from those anticipated.
Mitrade makes no representation or warranty as to the accuracy or completeness of the information provided and accepts no liability for any loss arising from reliance on such information.
Recommended Articles


