


CFDs are complex instruments and come with a high risk of losing money rapidly due to leverage. 78% of retail investor accounts lose money when trading CFDs with this provider. You should consider whether you understand how CFDs work and whether you can afford to take the high risk of losing your money.

Cardano Price Forecast: ADA extends gradual decline as breakdown risks grow

Source Fxstreet
  • Cardano steadies on Wednesday, maintaining a bearish near-term bias as it holds below key EMAs.
  • Derivatives data backs the bearish outlook with decreasing open interest and rising short positions.
  • On the technical side, momentum indicators show that bearish strength is gaining traction.

Cardano (ADA) steadies near $0.240 on Wednesday, continuing its three-consecutive weeks of losses and maintaining a bearish bias so far this week. Bearish derivatives metrics and weakening momentum hint at deeper losses for ADA.

Derivatives sentiment turns bearish

CoinGlass data shows that the futures’ Open Interest (OI) on the Binance exchange for Cardano slips to $98.01 million on Wednesday, down from the May 11 peak of $128.97 million. A declining OI indicates money flowing out of the market and a reduction in new buying interest, which could weaken momentum and increase the risk of further downside in Cardano price.
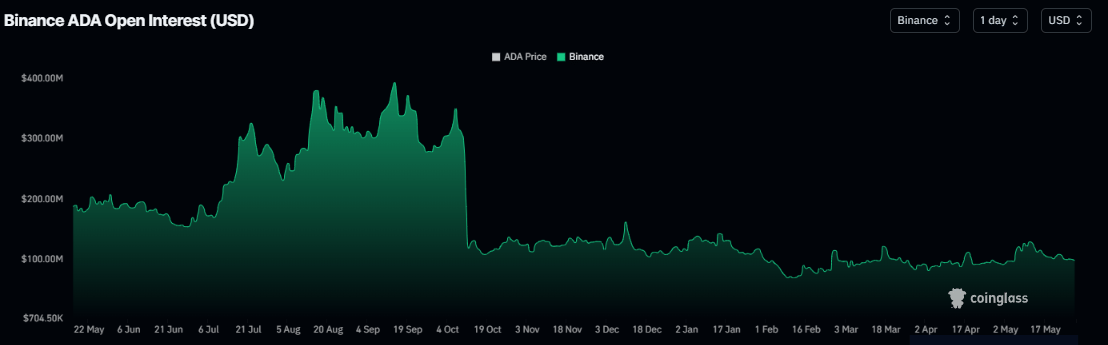
ADA open interest on the Binance chart. Source: Coinglass

In addition, Coinglass’s long-to-short ratio for ADA reads 0.70 on Wednesday, nearing the lowest level over a month. The ratio being below one, indicates bearish sentiment, as traders are betting the asset’s price will fall.
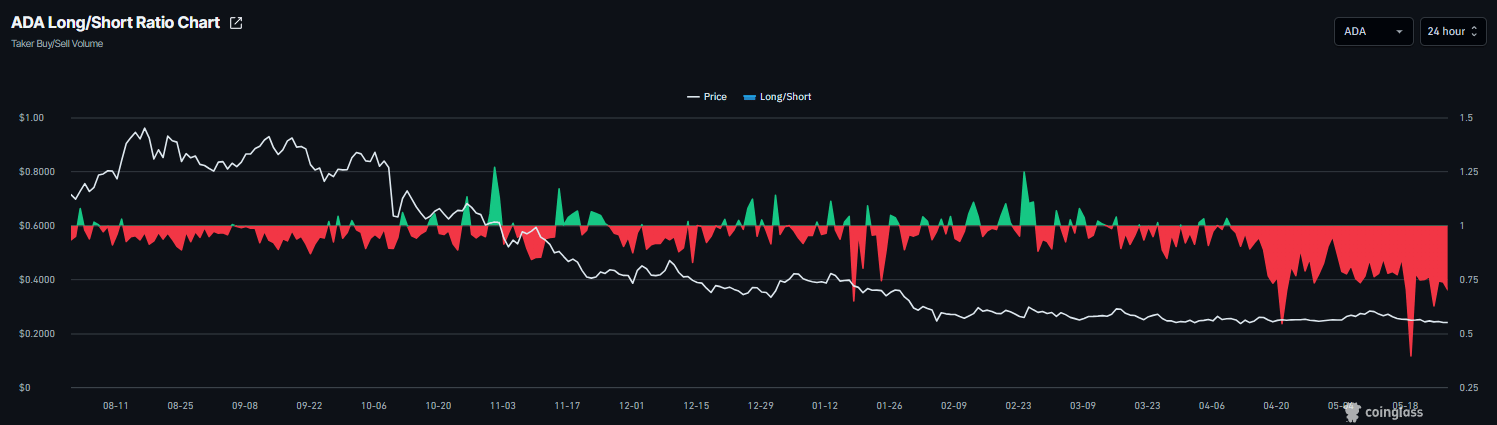
ADA long-to-short ratio chart. Source: Coinglass

Cardano Price Forecast: ADA on verge of a breakdown

Cardano price trades at $0.240 on Wednesday, holding in a bearish configuration as it remains capped beneath the 50-day, 100-day and 200-day Exponential Moving Averages (EMAs) at $0.255, $0.275 and $0.347, respectively. 

The Relative Strength Index (RSI) at 39 leans toward oversold territory. At the same time, the Moving Average Convergence Divergence (MACD) stays in negative territory, together suggesting persistent downside pressure despite a brief bounce from recent lows.

On the topside, initial resistance is aligned at the prior horizontal barrier near $0.245, followed by the 50-day EMA around $0.255 and the downtrend break level at $0.265; above that, the 23.6% Fibonacci retracement at $0.271 (drawn from January high to the February low) and the 100-day EMA at $0.275 add to a broader supply zone before stronger resistance emerges near $0.2991 and the 38.2% Fibonacci retracement at $0.303. 

On the downside, immediate support lies at the horizontal floor around $0.236, and a clear break of this level would expose the pair to further weakness within the broader bearish structure.
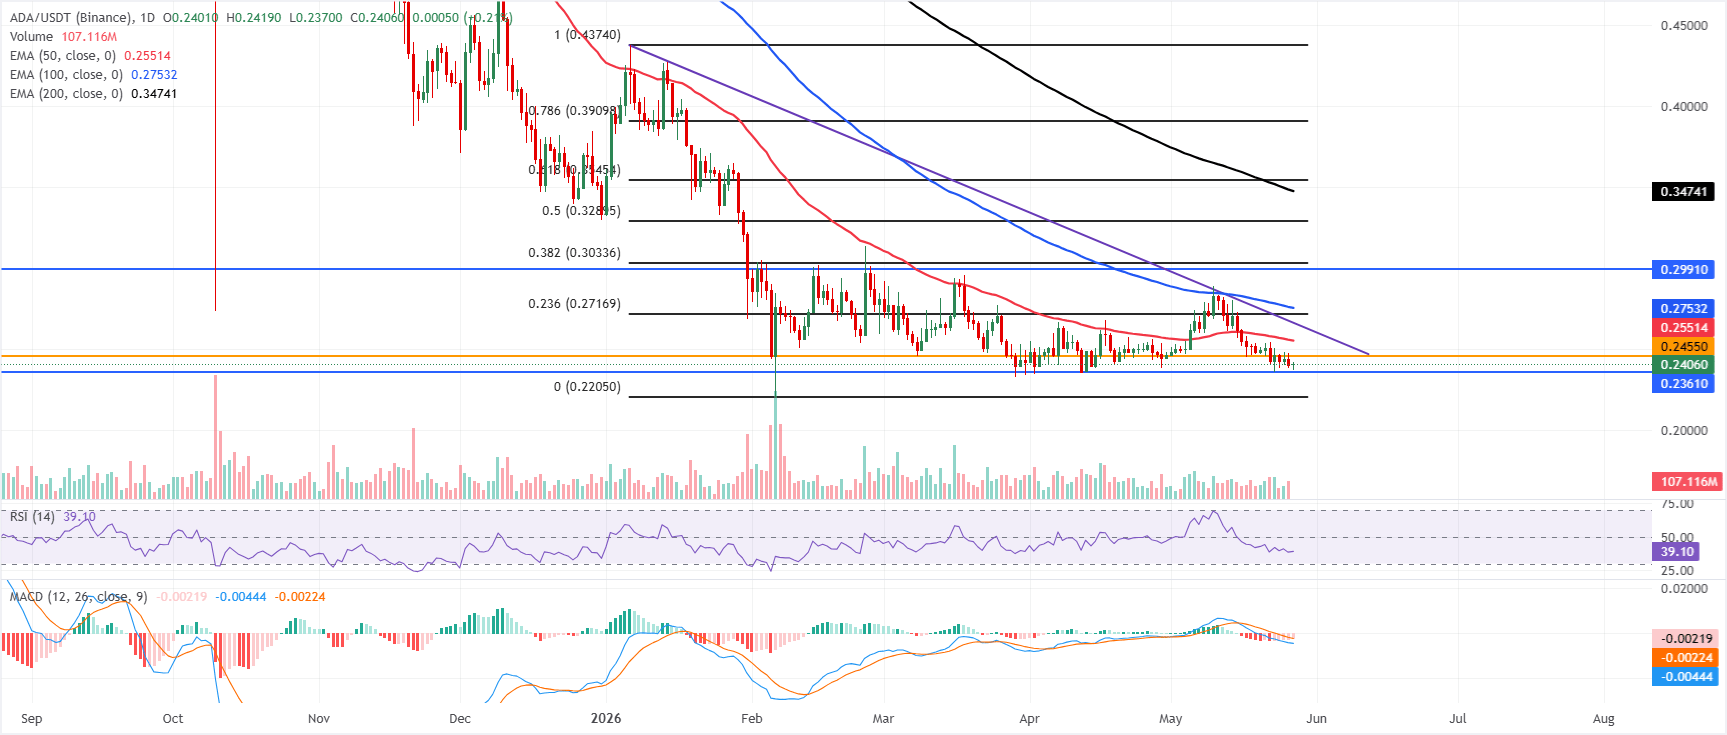
ADA/USDT daily chart

(The technical analysis of this story was written with the help of an AI tool.)

Disclaimer: The content available on Mitrade Insights is provided for informational and marketing purposes only. It has not been prepared in accordance with legal requirements designed to promote the independence of investment research and is not subject to any prohibition on dealing ahead of the dissemination of investment research
Nothing in this material constitutes investment advice, personal recommendation, investment research, an offer, or a solicitation to buy or sell any financial instrument. The content has been prepared without consideration of your individual investment objectives, financial situation, or needs, and should not be treated as such.
Past performance is not a reliable indicator of future performance and/or results. Forward-looking scenarios or forecasts are not a guarantee of future performance. Actual results may differ materially from those anticipated.
Mitrade makes no representation or warranty as to the accuracy or completeness of the information provided and accepts no liability for any loss arising from reliance on such information.
placeholder
Financial Markets 2026: Volatility Catalysts in Gold, Silver, Oil, and Blue-Chip Stocks—A CFD Trader's OutlookThe financial world is perpetually in motion, but the landscape for 2026 seems to be shaping up to be particularly dynamic. For CFD traders navigating global markets, this heightened volatility could present a distinctive set of challenges and opportunities.
Author  Rachel Weiss
May 18, Mon
The financial world is perpetually in motion, but the landscape for 2026 seems to be shaping up to be particularly dynamic. For CFD traders navigating global markets, this heightened volatility could present a distinctive set of challenges and opportunities.
placeholder
Silver price today: Silver rises, according to FXStreet dataSilver prices (XAG/USD) rose on Monday, according to FXStreet data. Silver trades at $81.78 per troy ounce, up 5.54% from the $77.48 it cost on Friday.
Author  FXStreet
Feb 09, Mon
Silver prices (XAG/USD) rose on Monday, according to FXStreet data. Silver trades at $81.78 per troy ounce, up 5.54% from the $77.48 it cost on Friday.
placeholder
Silver Price Forecast: XAG/USD bulls seem hesitant below $82.00; US NFP awaitedSilver (XAG/USD) steadies following the previous day's modest pullback from the $84.00 mark and trades with a mild positive bias during the Asian session on Wednesday.
Author  FXStreet
Feb 11, Wed
Silver (XAG/USD) steadies following the previous day's modest pullback from the $84.00 mark and trades with a mild positive bias during the Asian session on Wednesday.
placeholder
USD: Liquidity backstops and war pressures – CommerzbankCommerzbank’s Michael Pfister discusses how US allies in Middle East and Asia are seeking Dollar swap lines as conflicts curb energy exports and tourism.
Author  Reuters
Apr 24, Fri
Commerzbank’s Michael Pfister discusses how US allies in Middle East and Asia are seeking Dollar swap lines as conflicts curb energy exports and tourism.
placeholder
Japan's Nikkei closes at record high as tech earnings overshadow Mideast concernsBy Rocky Swift TOKYO, April 24 (Reuters) - Japan's Nikkei set a closing record high on Friday, capping a third consecutive weekly gain, as enthusiasm over technology sector earnings offset uncertainty over a potential peace deal in the Middle East.The benchmark Nikkei 225 Index .N225 rose 0.9...
Author  Reuters
Apr 24, Fri
By Rocky Swift TOKYO, April 24 (Reuters) - Japan's Nikkei set a closing record high on Friday, capping a third consecutive weekly gain, as enthusiasm over technology sector earnings offset uncertainty over a potential peace deal in the Middle East.The benchmark Nikkei 225 Index .N225 rose 0.9...
Related Instrument
goTop
quote