



Near Protocol Price Forecast: NEAR pulls back as demand cools
- NEAR trims gains and holds above $2.50 on Wednesday amid broader profit-taking activity.
- NEAR derivatives market loses momentum, with perpetual futures Open Interest falling to $747 million.
- NEAR momentum indicators remain overextended, suggesting that further cooling may be imminent.
Near Protocol (NEAR) edges lower on Wednesday, holding above the $2.50 support. The drawdown can be partly attributed to broader crypto market volatility as investors continue to assess geopolitical tensions in the Middle East and to profit-taking following its over 100% rally in May.
NEAR Protocol falters as demand softens
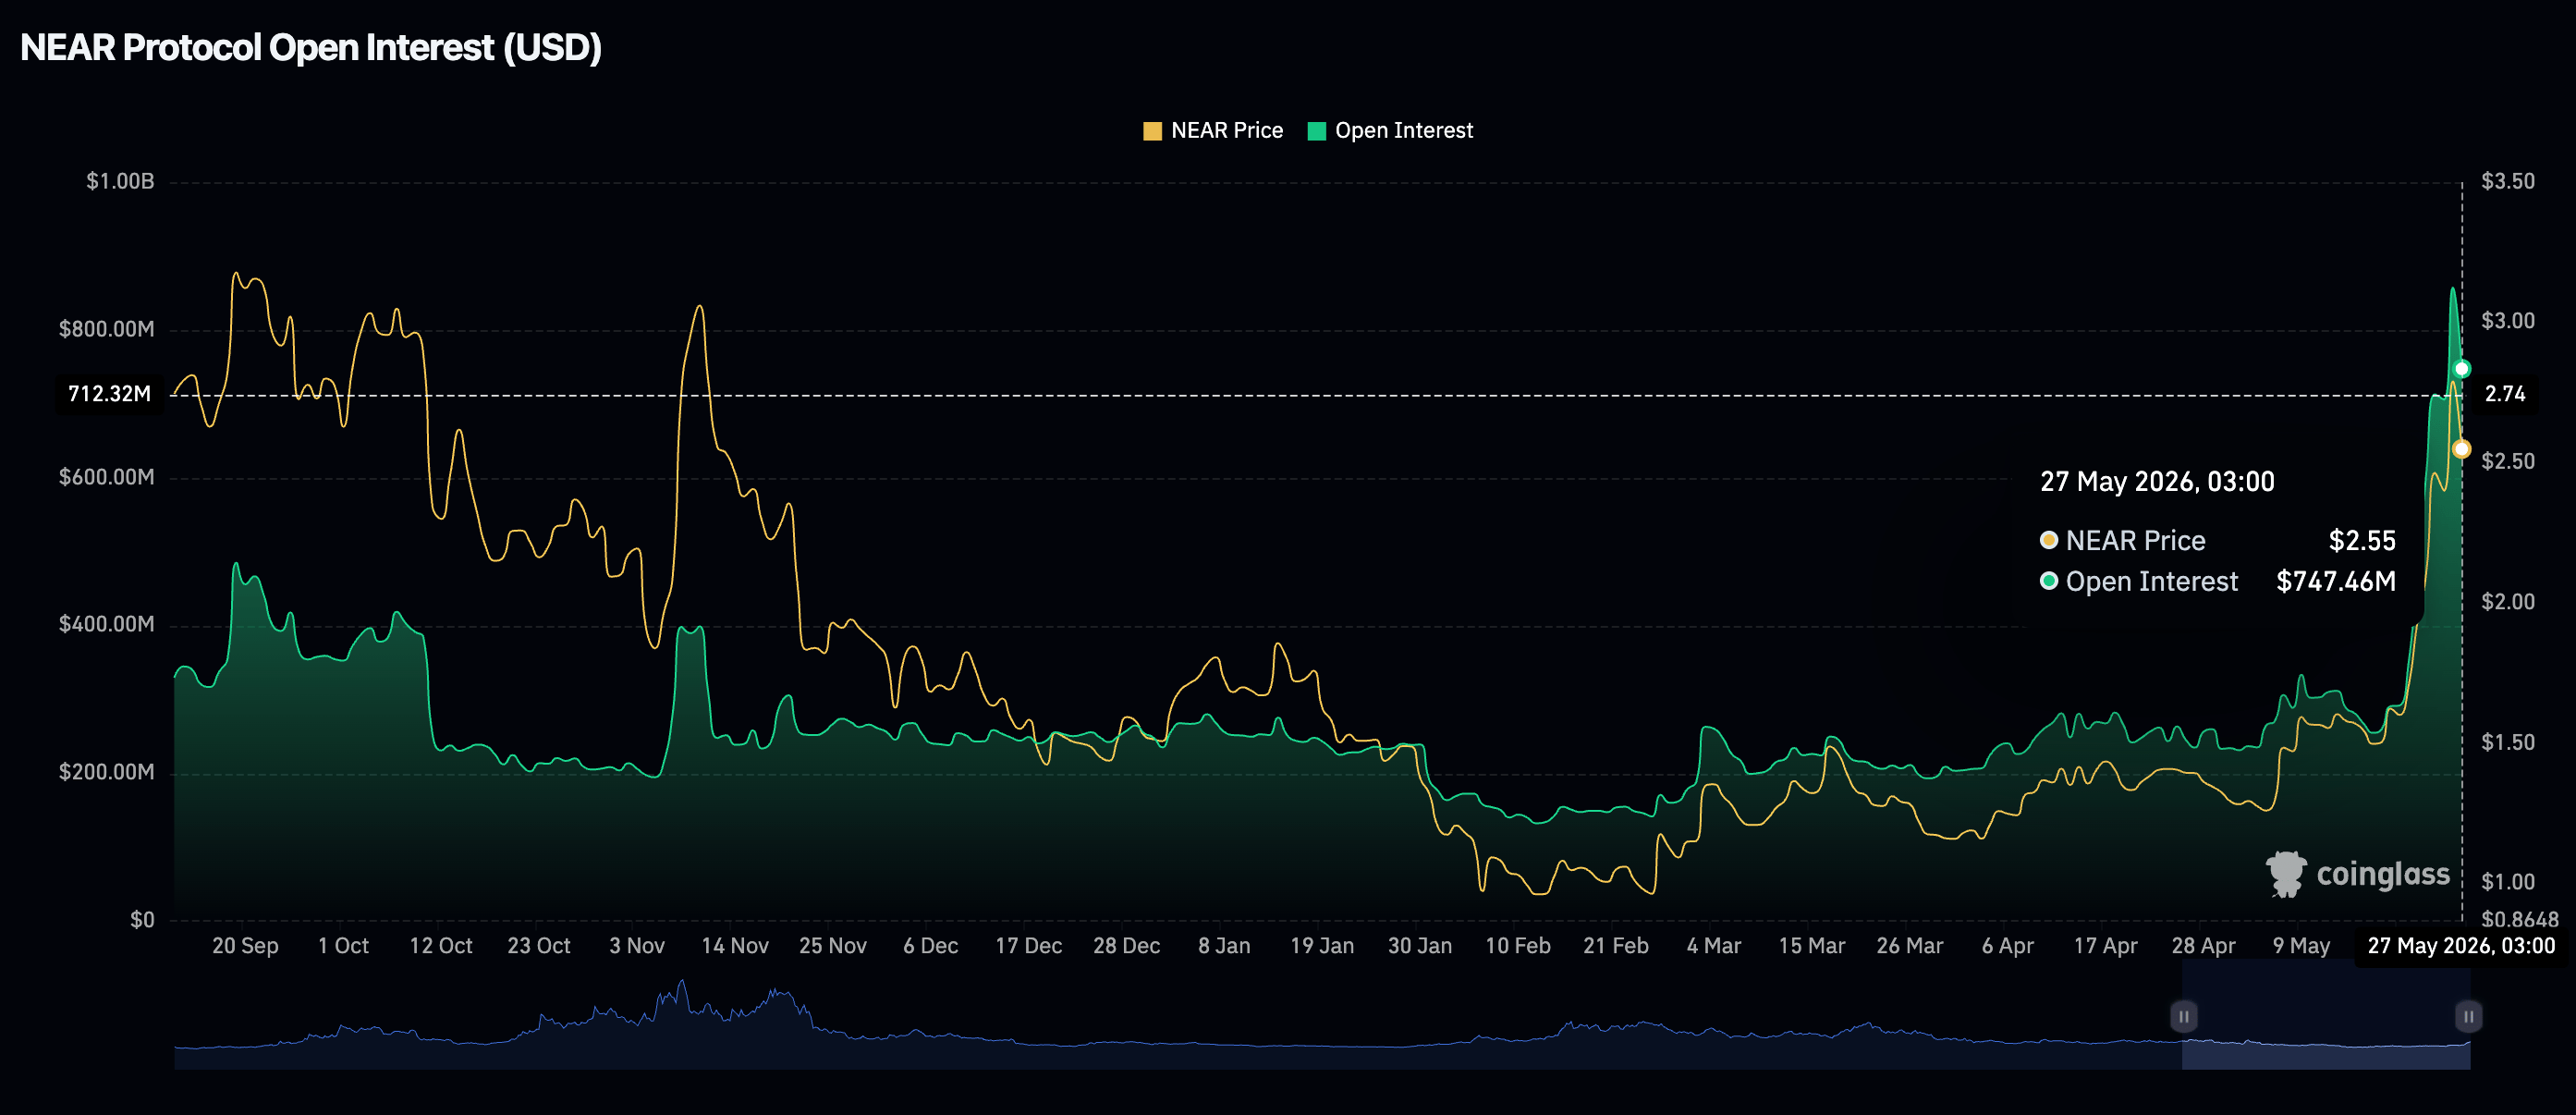
Retail demand for NEAR derivatives is shrinking, as reflected by the drop in perpetual futures Open Interest (OI) to $747 million on Wednesday from $857 million the day before.
The drawdown coincides with the current correction, which has seen NEAR test support at $2.50, down from its yearly peak of $2.97. Further decline in OI suggests investors are losing confidence in the token’s short to medium-term outlook and are unwilling to open new positions.
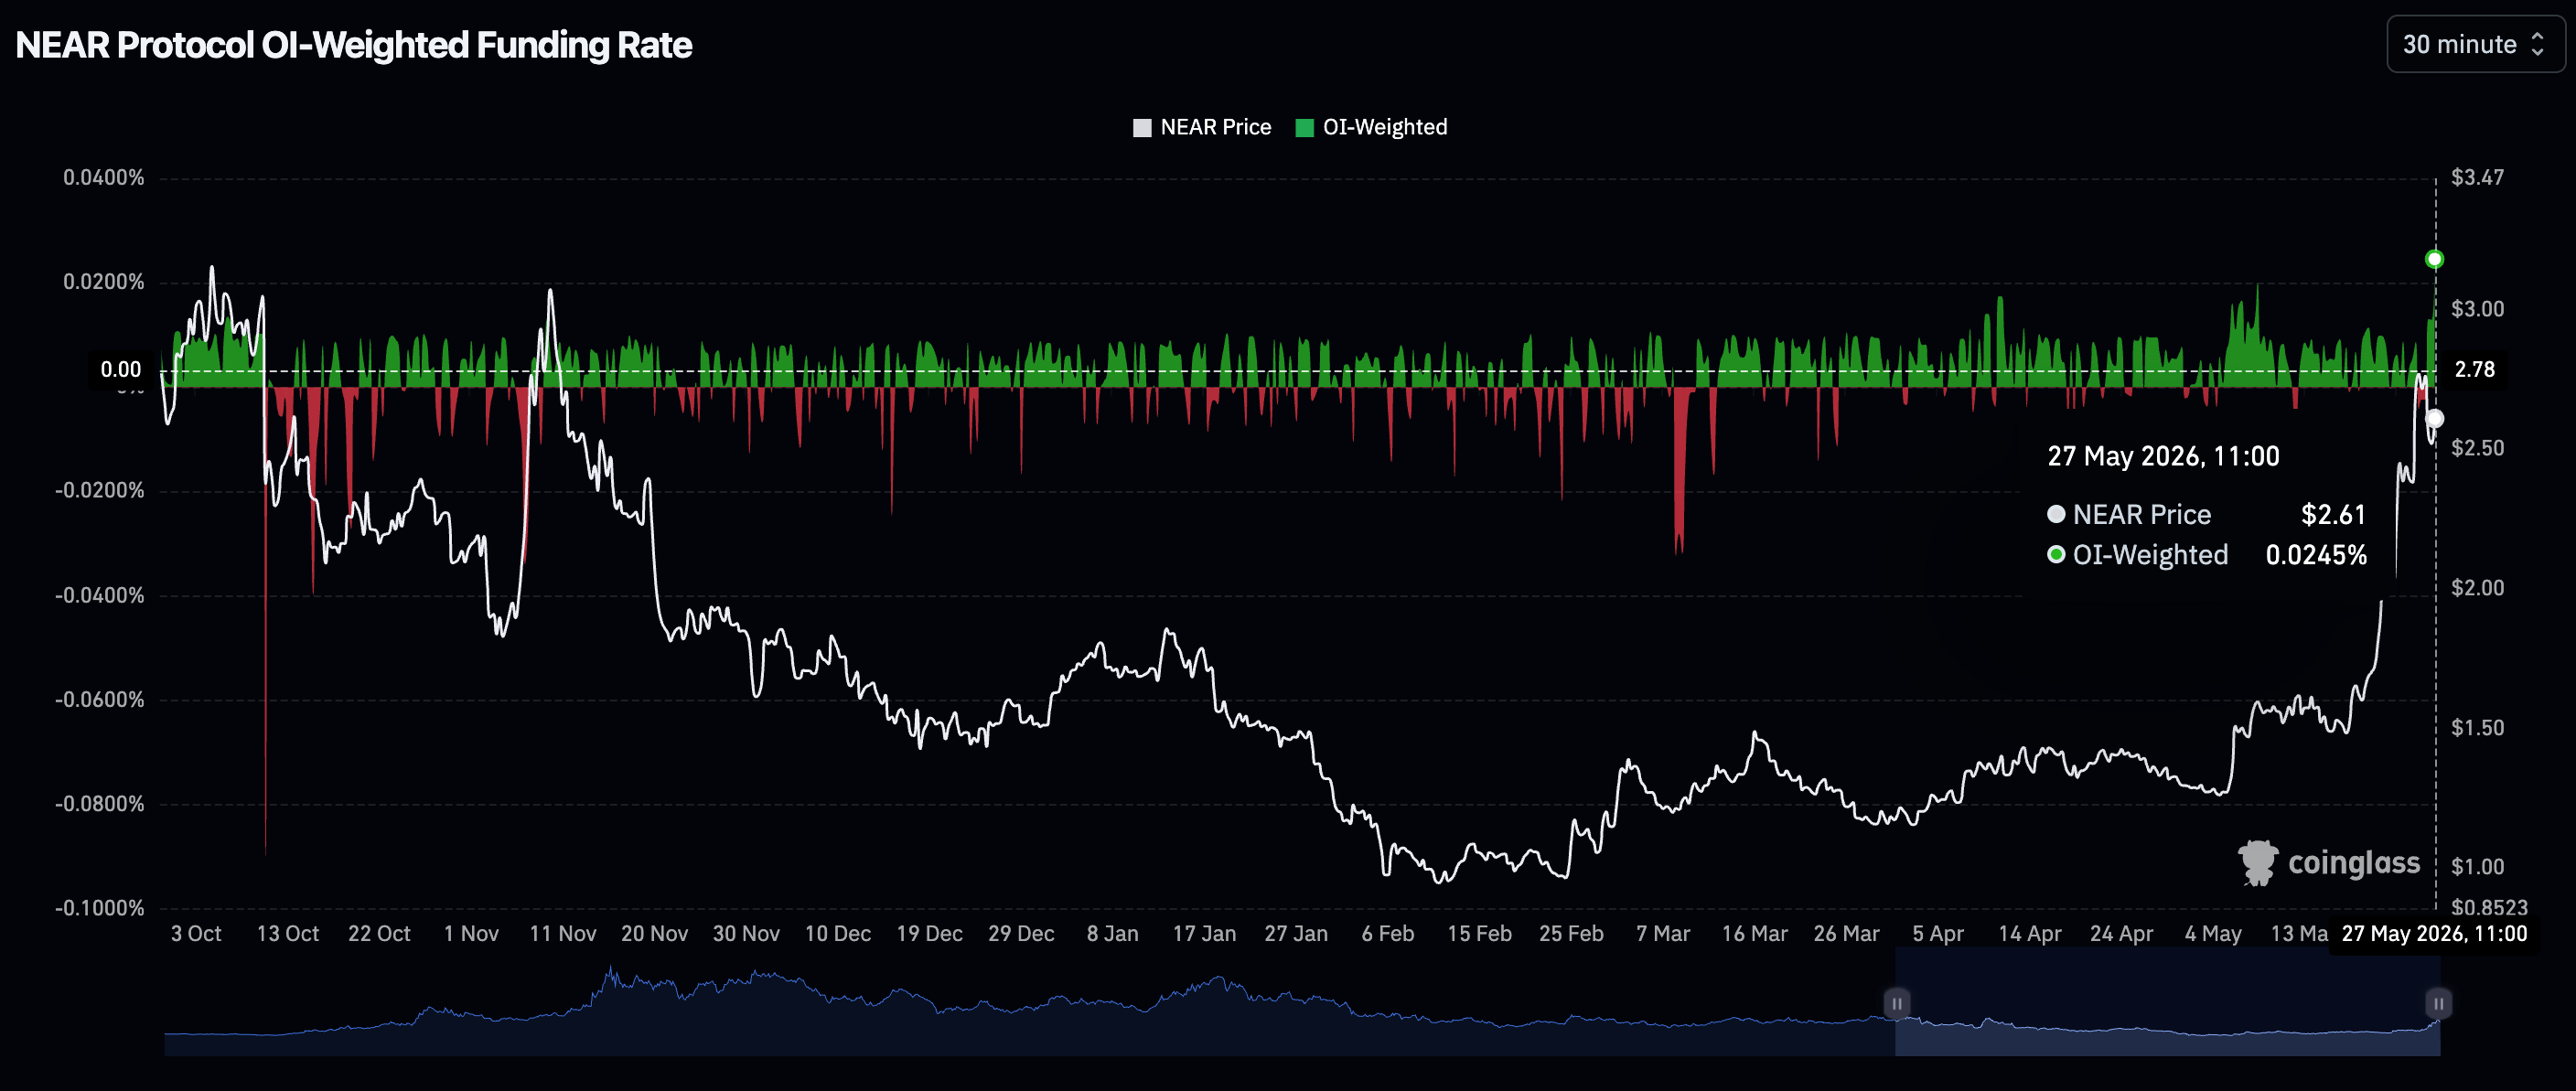
Notably, traders are increasingly piling into long positions in NEAR, as evidenced by the OI-Weighted Funding Rate holding in positive territory around 0.0245%. This shows that interest in NEAR remains relatively high, possibly due to the narrative around Artificial Intelligence (AI) tokens. If funding rates remain unchanged, an increase in buy-the-dip demand could bolster NEAR’s bullish outlook.
Price analysis: NEAR tests short-term support
NEAR trades at $2.55, extending a strong bullish phase after reclaiming and accelerating away from its key moving averages. The spot price stands well above the 50-day, 100-day and 200-day Exponential Moving Averages (EMAs), which fan out to the downside and suggest a firmly supportive underlying trend, while the SuperTrend line at roughly $2.05 reinforces this structural floor.
Momentum remains positive, with the Moving Average Convergence Divergence (MACD) indicator holding in positive territory and its histogram elevated, although the Relative Strength Index (RSI) near 75 hints at overbought conditions that could favor consolidation or a corrective pause rather than immediate continuation.
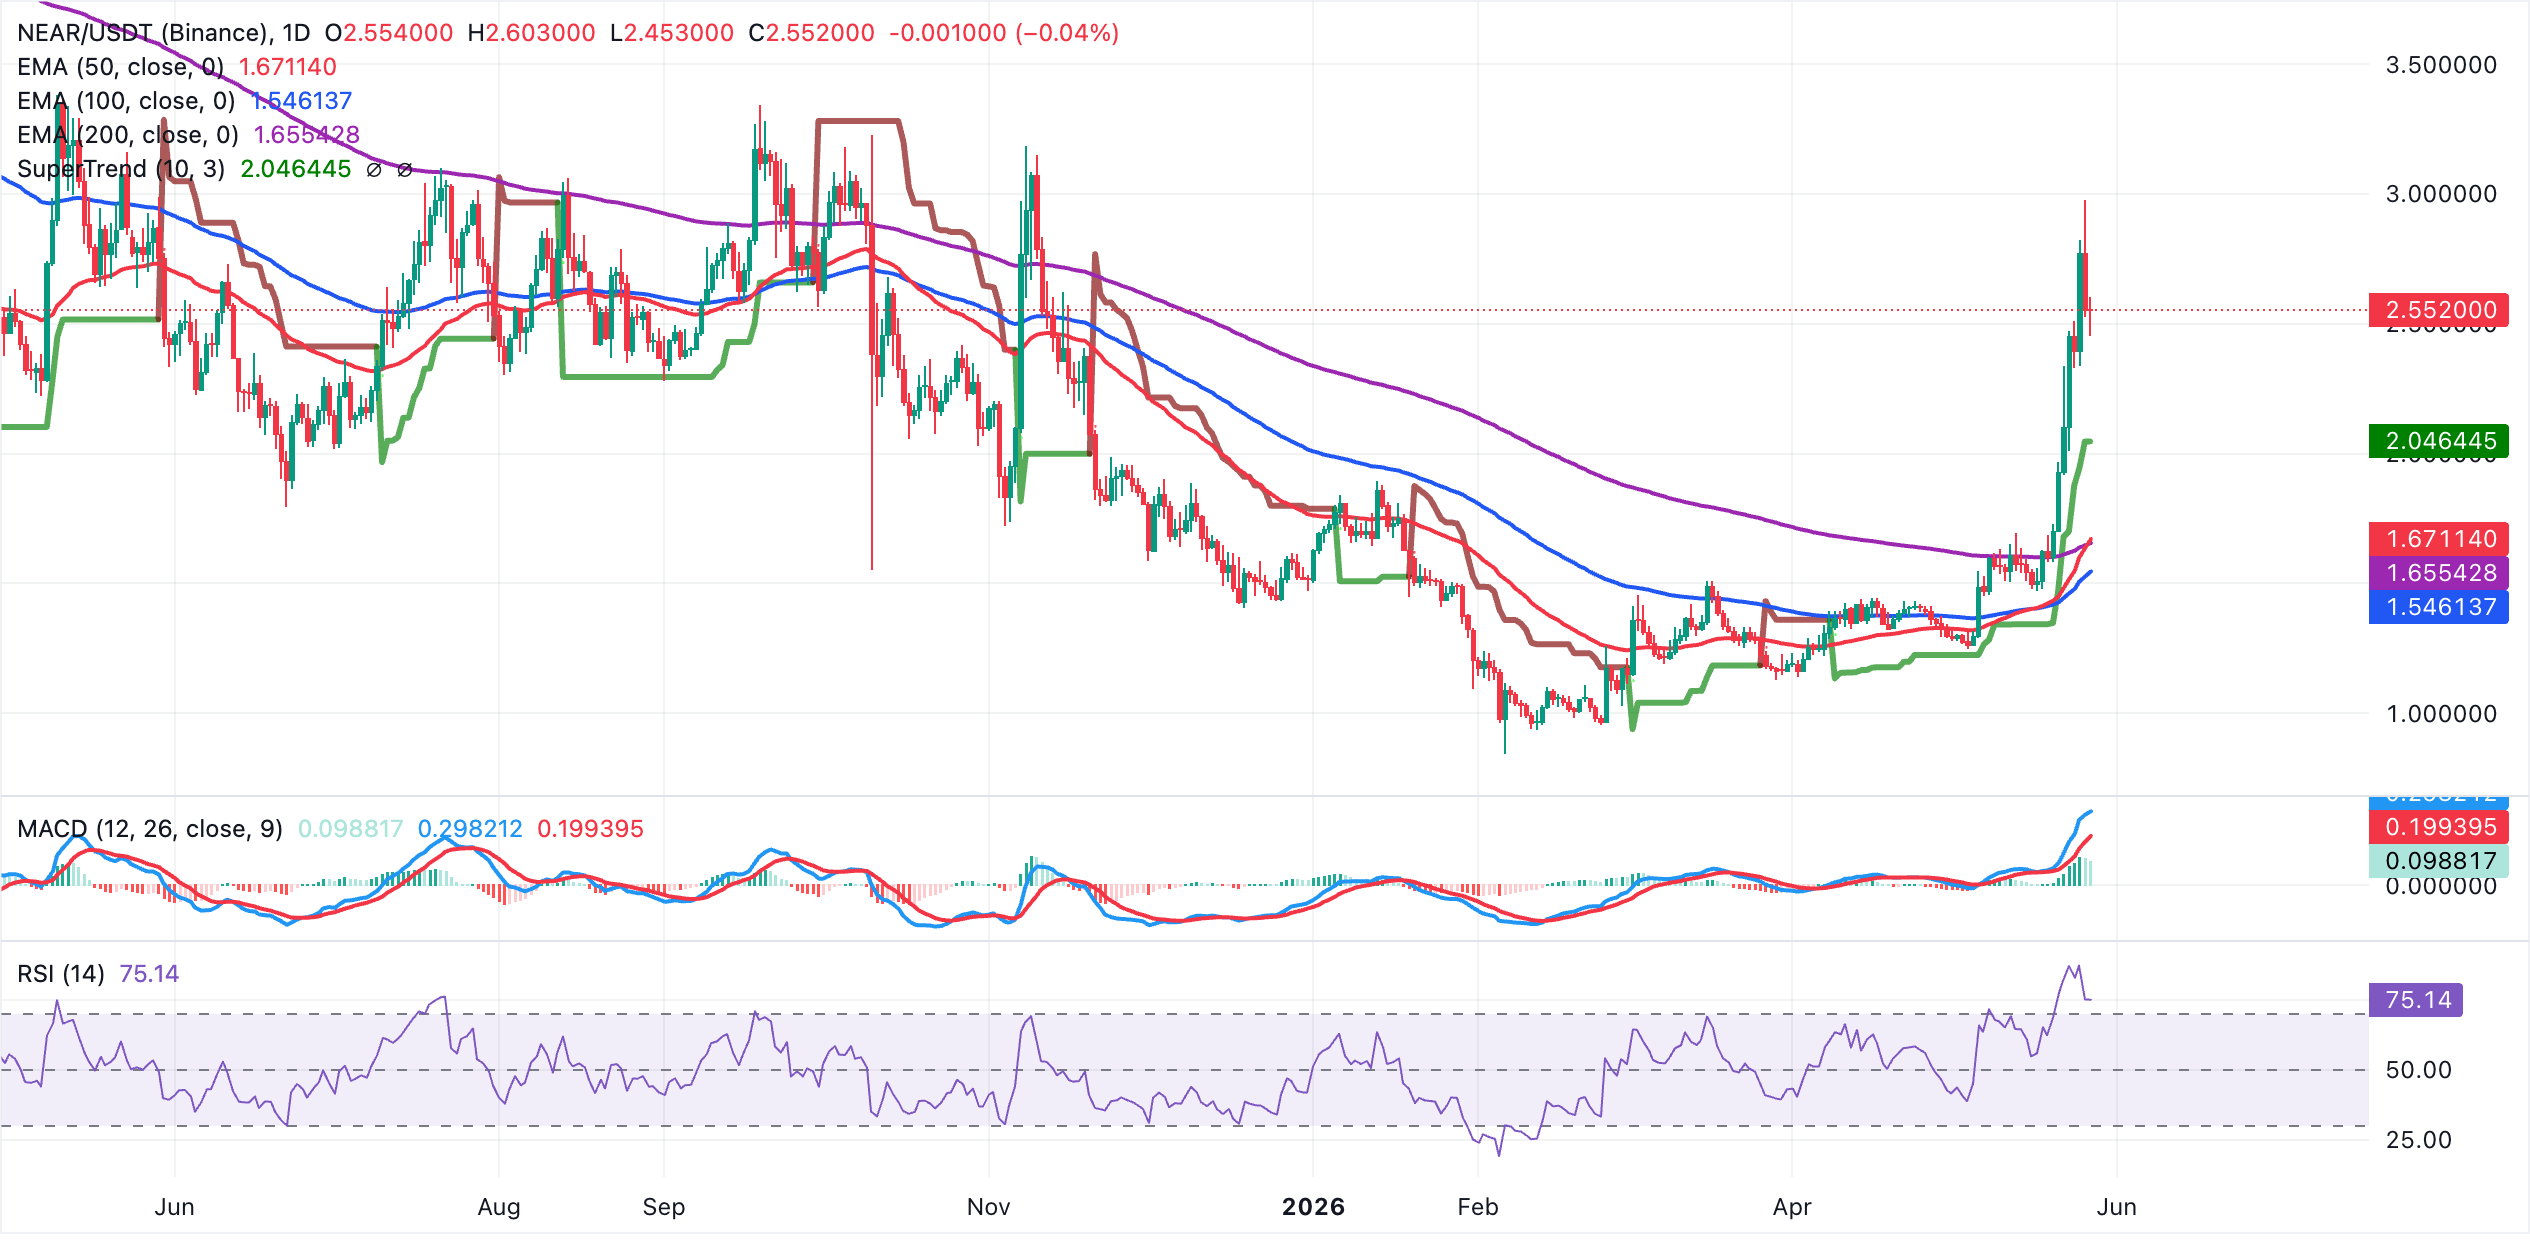
On the downside, initial support is located around the SuperTrend level at $2.05, where prior breakout dynamics could encourage dip buying on a pullback. Below that, a cluster of medium and long-term supports emerges at the 50-day EMA near $1.67, the 200-day EMA close to $1.66, and the 100-day EMA around $1.55, levels that would be expected to attract stronger demand if a deeper correction unfolds, keeping the broader bullish structure intact while above them.
(The technical analysis of this story was written with the help of an AI tool.)
Open Interest, funding rate FAQs
Higher Open Interest is associated with higher liquidity and new capital inflow to the market. This is considered the equivalent of increase in efficiency and the ongoing trend continues. When Open Interest decreases, it is considered a sign of liquidation in the market, investors are leaving and the overall demand for an asset is on a decline, fueling a bearish sentiment among investors.
Funding fees bridge the difference between spot prices and prices of futures contracts of an asset by increasing liquidation risks faced by traders. A consistently high and positive funding rate implies there is a bullish sentiment among market participants and there is an expectation of a price hike. A consistently negative funding rate for an asset implies a bearish sentiment, indicating that traders expect the cryptocurrency’s price to fall and a bearish trend reversal is likely to occur.
Nothing in this material constitutes investment advice, personal recommendation, investment research, an offer, or a solicitation to buy or sell any financial instrument. The content has been prepared without consideration of your individual investment objectives, financial situation, or needs, and should not be treated as such.
Past performance is not a reliable indicator of future performance and/or results. Forward-looking scenarios or forecasts are not a guarantee of future performance. Actual results may differ materially from those anticipated.
Mitrade makes no representation or warranty as to the accuracy or completeness of the information provided and accepts no liability for any loss arising from reliance on such information.
Recommended Articles


